COBBLESTONE SOFTWARE
Contract Insight — User Guide
System Dashboards
Application Configuration: Building and Assigning Dashboards
Note: Each procedure in this guide begins at the Contract Insight homepage, so any section can be followed on its own. The reports, saved searches and widgets offered on a dashboard depend on what exists in the environment, so the exact choices may vary between systems.
1. Overview
System Dashboards allow administrators to build dashboards for other people and to choose who receives them. A dashboard gathers the reports, saved searches, tiles and other content a group of users should see in one place, so that everyone in that group opens the same view of the system.
Each system dashboard carries a Name, an optional Description, a Column split used by the classic application, and a setting for where it appears — either inside Contract Insight or in the Vendor-Client Gateway. Where a dashboard appears is fixed when the dashboard is created and cannot be changed afterwards.
Content is added to a dashboard from its Layout screen, which offers both widgets (a web address, an Ad-Hoc, Custom or Report Designer report, a saved search, or the search engine) and tiles (a button tile that acts as a shortcut, or a summary tile that shows a single number drawn from a report). Once the layout is arranged, the dashboard is assigned to individual employees, employee role groups, or security groups, and it can be set to open first when those people sign in.
Because system dashboards are maintained from the Administration area, only Application Administrators — or other users specifically granted the appropriate permission — can create, edit, assign or delete them. Standard users can open the dashboards assigned to them, and can build their own personal dashboards, but cannot hand a dashboard to anyone else.
2. Accessing System Dashboards
The System Dashboards list is the central management screen for every dashboard handed out to other people. To open it:
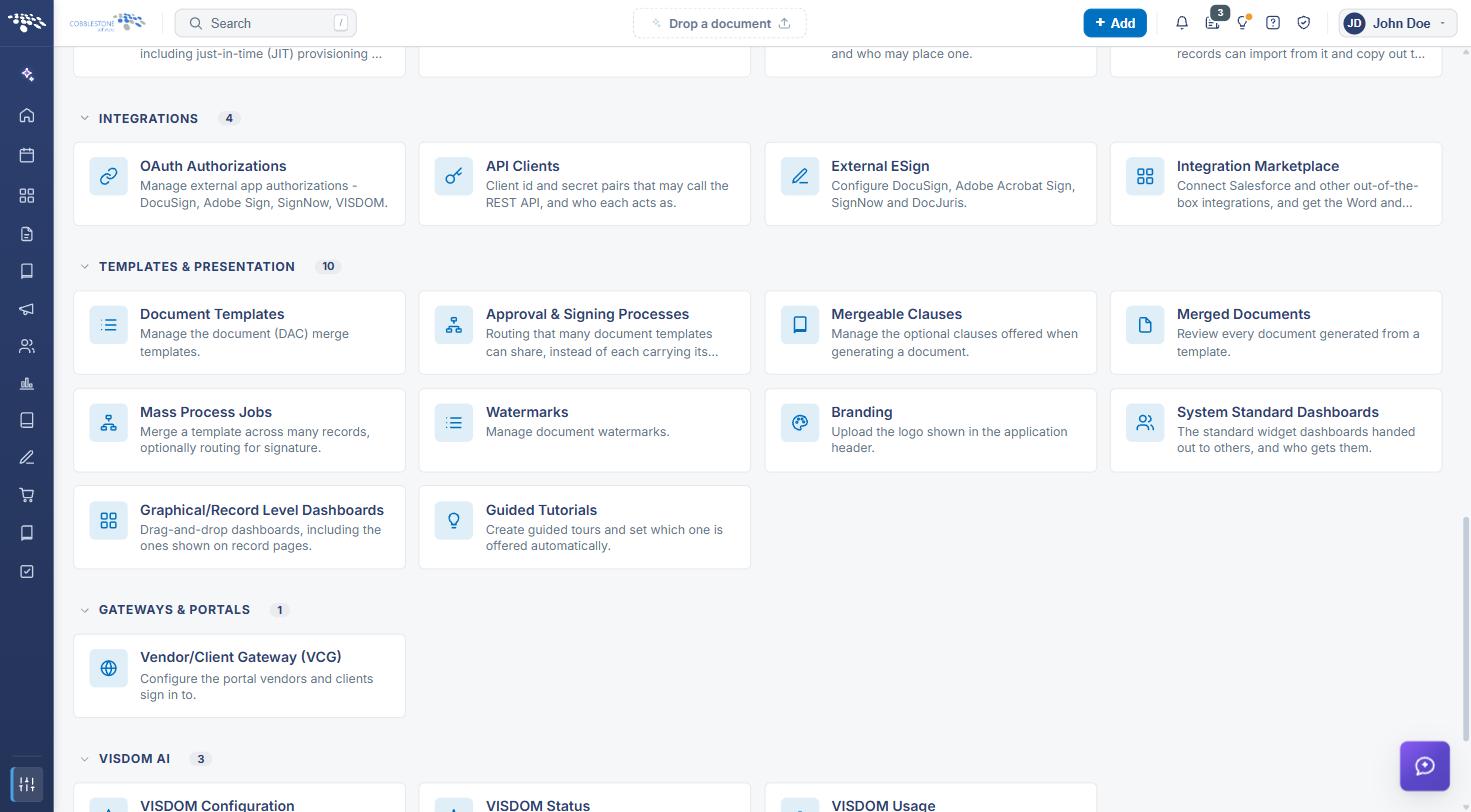
From the Contract Insight homepage, click Administration at the bottom of the left navigation menu. On the Administration page, under Templates & Presentation, select System Dashboards.
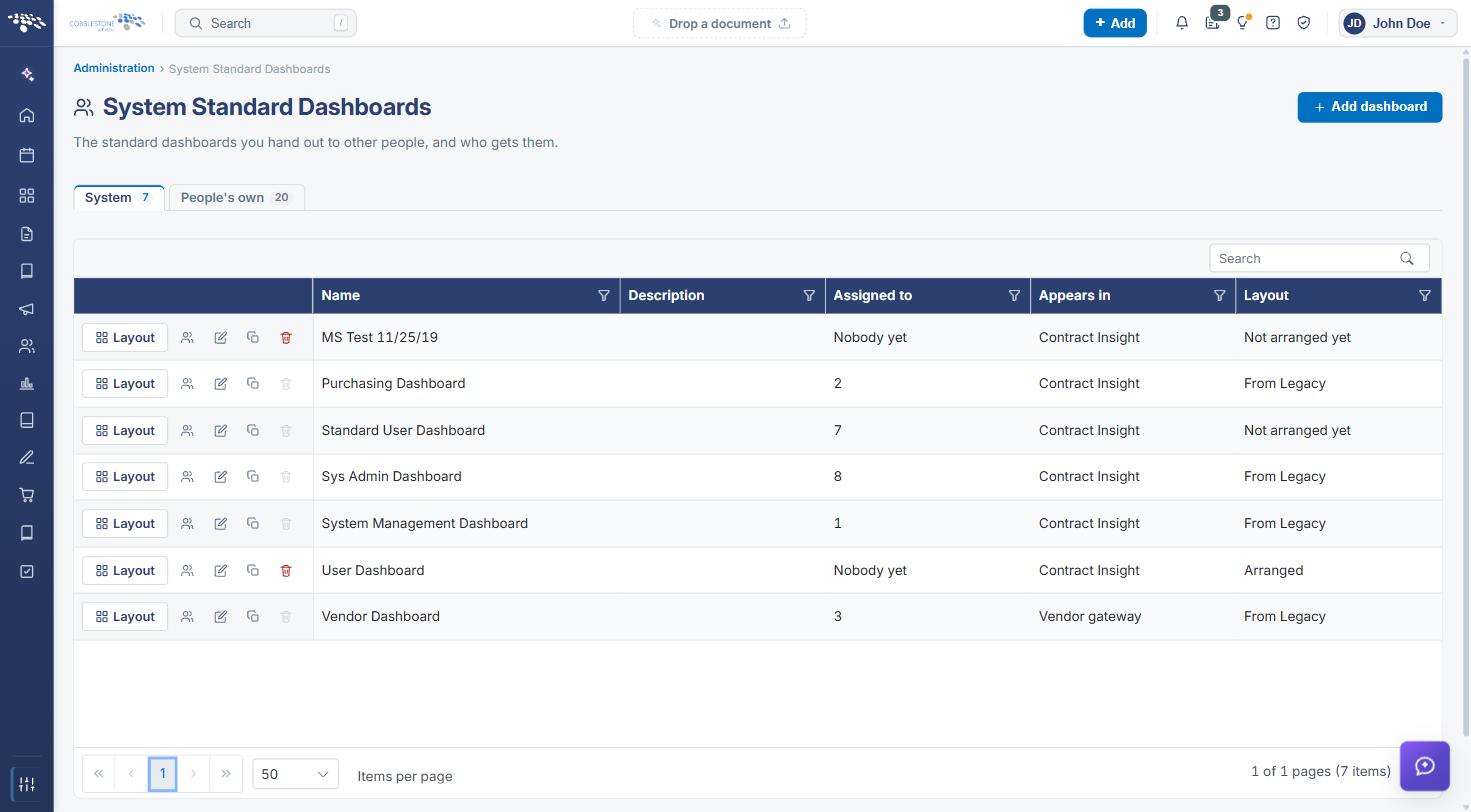
The System Dashboards screen includes the following elements:
- A System Dashboards heading with the subtitle “The dashboards you hand out to other people, and who gets them.”
- An Add dashboard button at the top of the screen
- A System tab and a People’s own tab, each showing a live count of the dashboards it holds
- A Search box above the grid to filter it by keyword
- A sortable, filterable grid with Name, Description, Assigned to, Appears in, and Layout columns, each with its own filter icon
- An Assigned to value of either a count of the people and groups holding the dashboard or “Nobody yet”, and a Layout value of either “Arranged” or “Not arranged yet”
- Per-row Layout, Assign, Edit info, Copy and Delete action buttons
- Pagination controls at the bottom of the grid, with a live page and record count and an Items per page selector
3. Creating a System Dashboard
Steps:
- From the Contract Insight homepage, click Administration at the bottom of the left navigation menu. On the Administration page, under Templates & Presentation, select System Dashboards.
- Click Add dashboard at the top of the list.
- The Add system dashboard panel slides out from the right, headed SYSTEM DASHBOARD / Add system dashboard.
- Enter the Name — this is what the people who receive the dashboard will see — and, optionally, a Description describing what the dashboard is for.
- Choose a Column split, which is used by the classic application: One full-width column, Two even columns, or Custom. Selecting Custom reveals Left and Right width fields, which default to 49 each and have to add up to 98.
- Set Where it appears to either Inside Contract Insight or Vendor-Client Gateway.
- Click Create to save the dashboard, or Cancel to discard it.
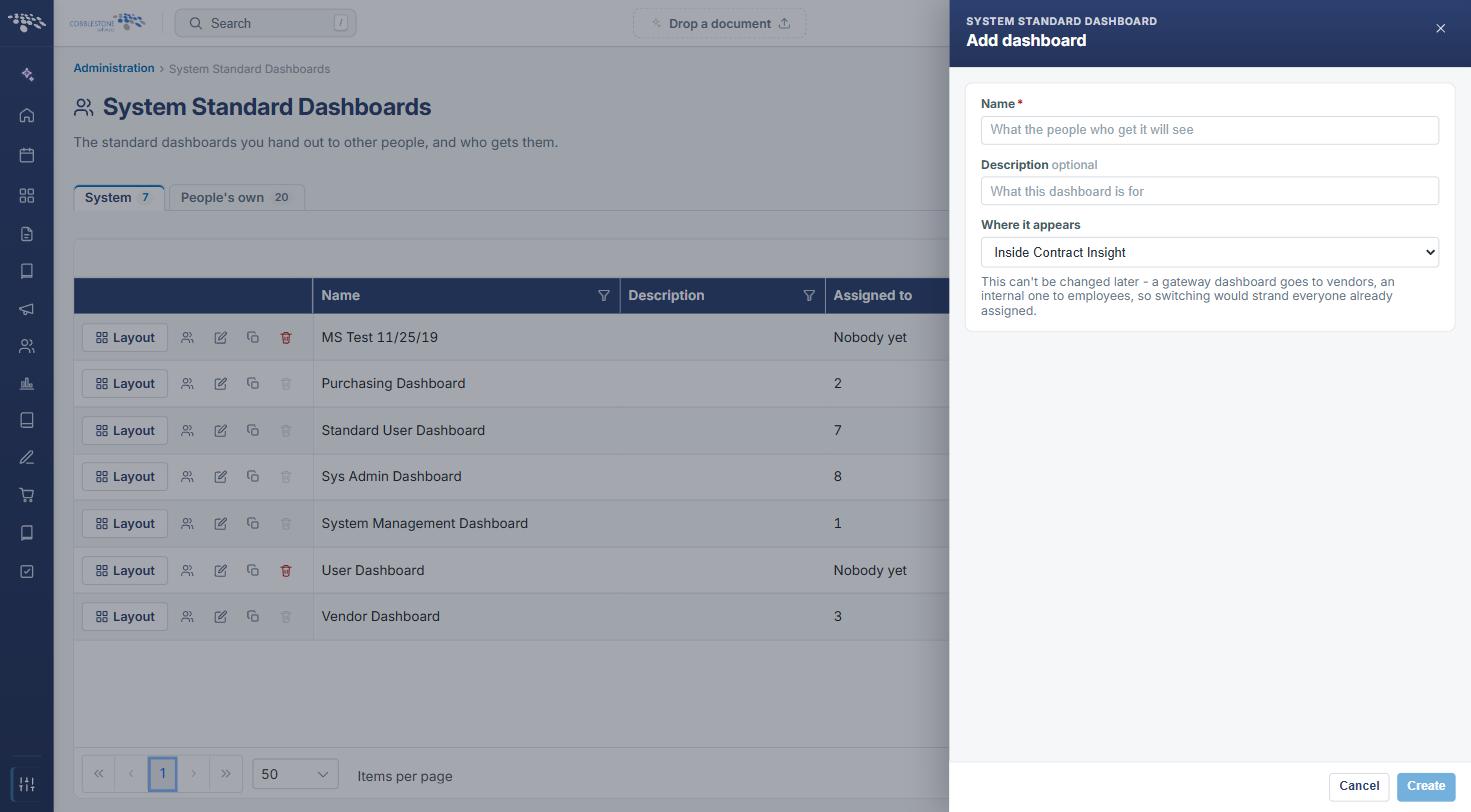
Note: Where a dashboard appears cannot be changed later — a gateway dashboard goes to vendors and an internal one goes to employees, so switching would strand everyone already assigned. A new dashboard is created empty; use Layout to add content to it and Assign to give it to people.
4. Managing System Dashboards
Navigate to the System Dashboards list as described in Section 2. Each row on the System tab carries the following buttons:
- Layout — opens the dashboard’s layout screen, where widgets and tiles are added and arranged
- Assign — opens the assignment panel, where the dashboard is given to people and groups
- Edit info — reopens the dashboard’s details (Name, Description and Column split) for editing
- Copy — duplicates the dashboard, including its layout, as a new dashboard
- Delete — removes the dashboard; the button is unavailable while anyone still holds it, and reads “N people or groups still have this dashboard — unassign them first.”
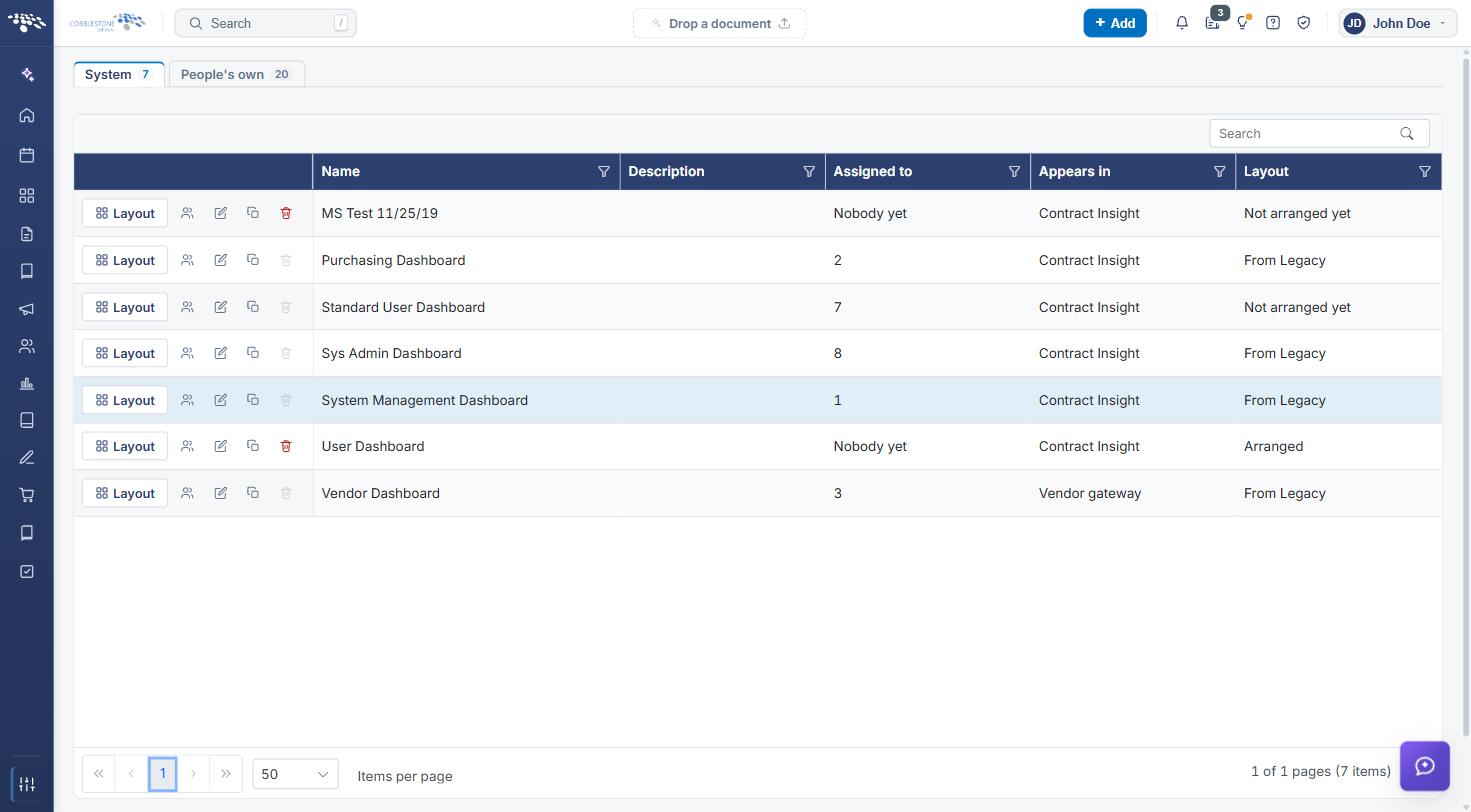
Note: The Where it appears setting does not appear on the Edit info panel, because it is fixed when the dashboard is created.
5. Building the Dashboard Layout
Steps:
- From the Contract Insight homepage, click Administration at the bottom of the left navigation menu. On the Administration page, under Templates & Presentation, select System Dashboards.
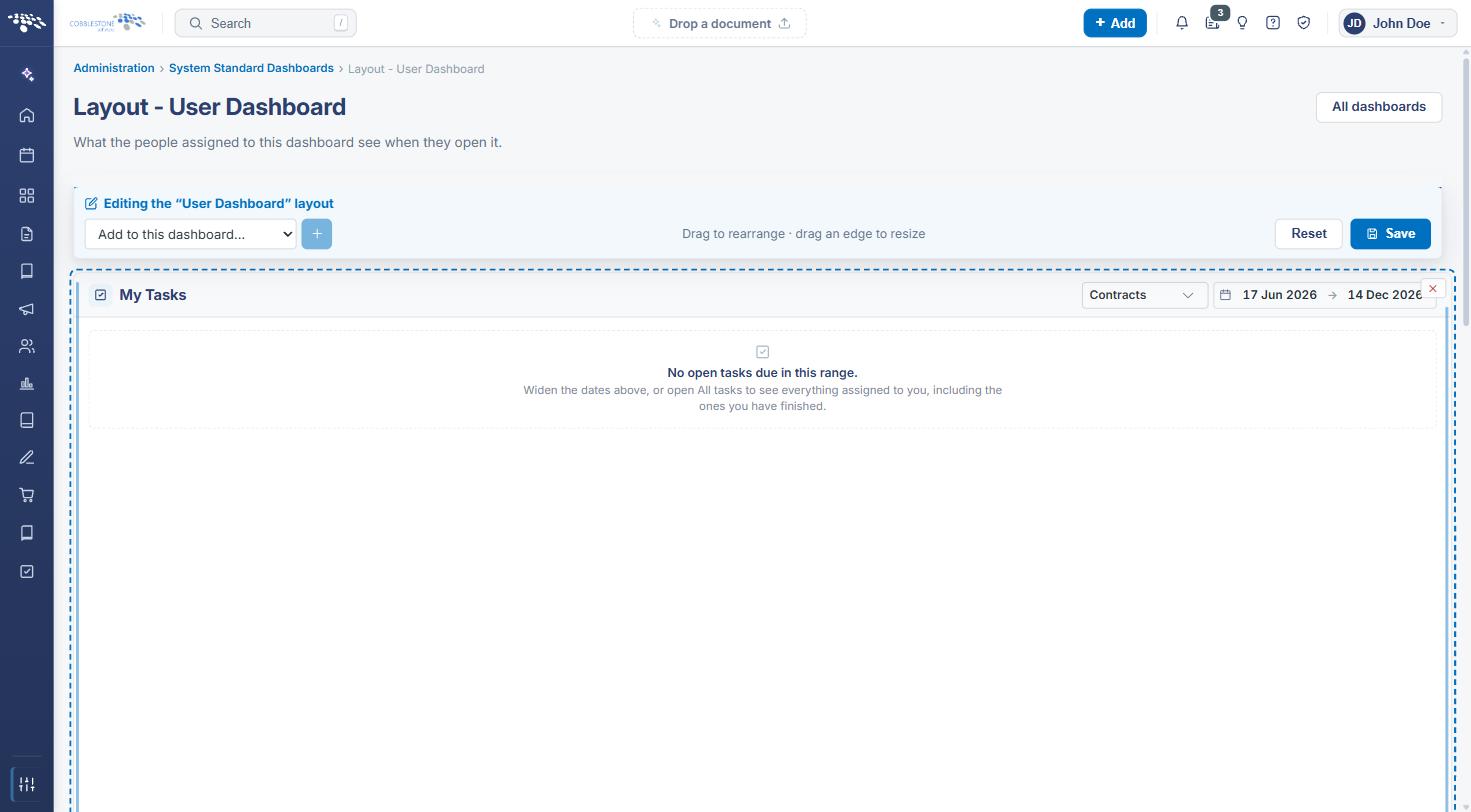
- Click Layout on the row for the dashboard you want to build. The layout page opens, titled Layout — <dashboard name>, with the subtitle “What the people assigned to this dashboard see when they open it.”
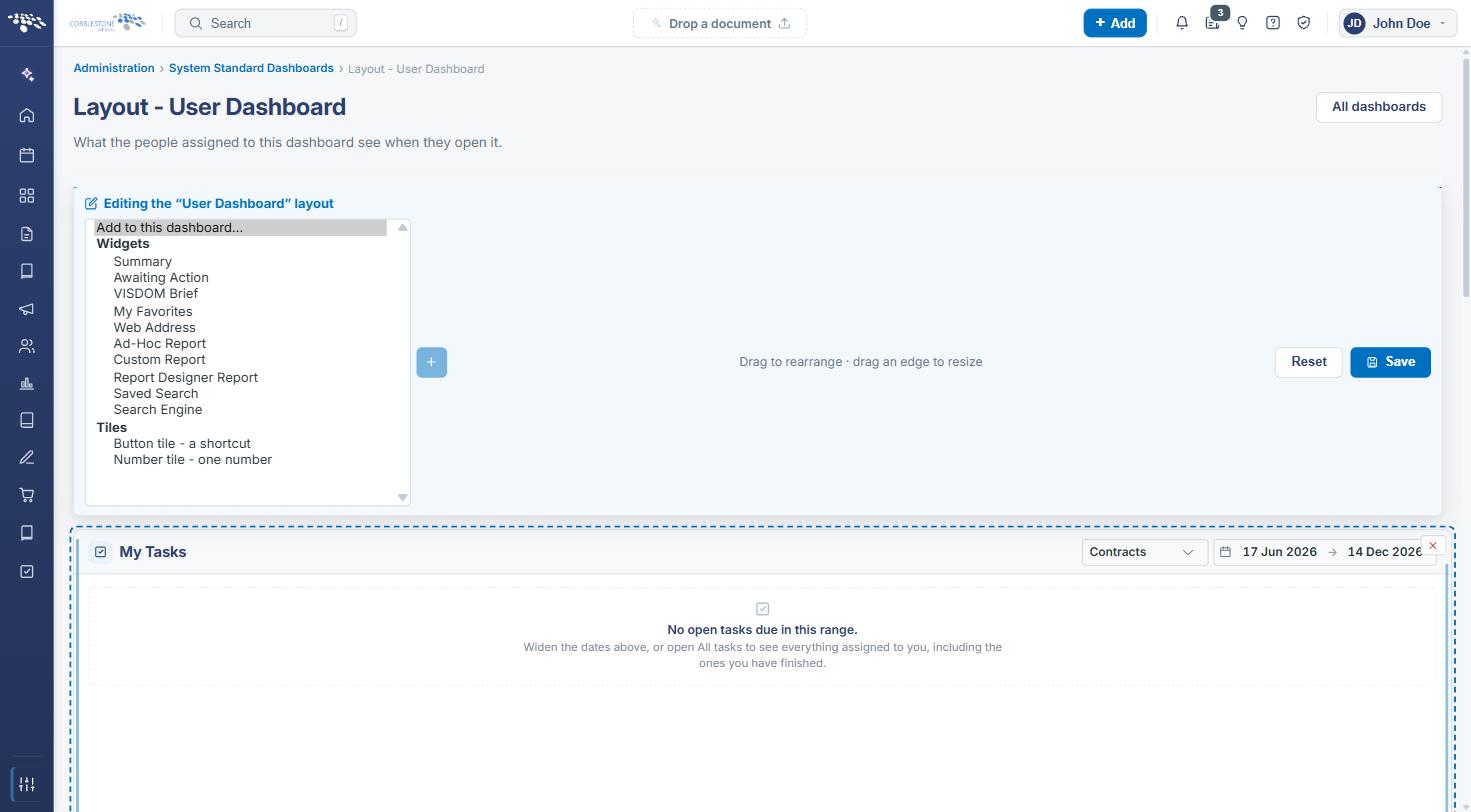
- Choose an item from the Add to this dashboard… dropdown, complete any control that appears beside it, then click + Add.
- Arrange the result: drag a widget to rearrange it, drag an edge to resize it, and use the ✕ in a widget’s corner to remove it. Tiles are reordered with their move-earlier and move-later arrows.
- Click Reset to default to return the dashboard to the standard layout, or Done to finish. All dashboards in the upper right returns to the list.
5.1 Widgets
The Widgets group of the dropdown adds a panel to the body of the dashboard:
- Web Address — embeds a page; enter the address in the box that appears beside the dropdown
- Ad-Hoc Report, Custom Report and Report Designer Report — each shows a report on the dashboard; pick it from the “Choose a report…” list that appears
- Saved Search — shows the results of a saved search; pick it from the list that appears
- Search Engine — places the search box on the dashboard
5.2 Summary Tiles
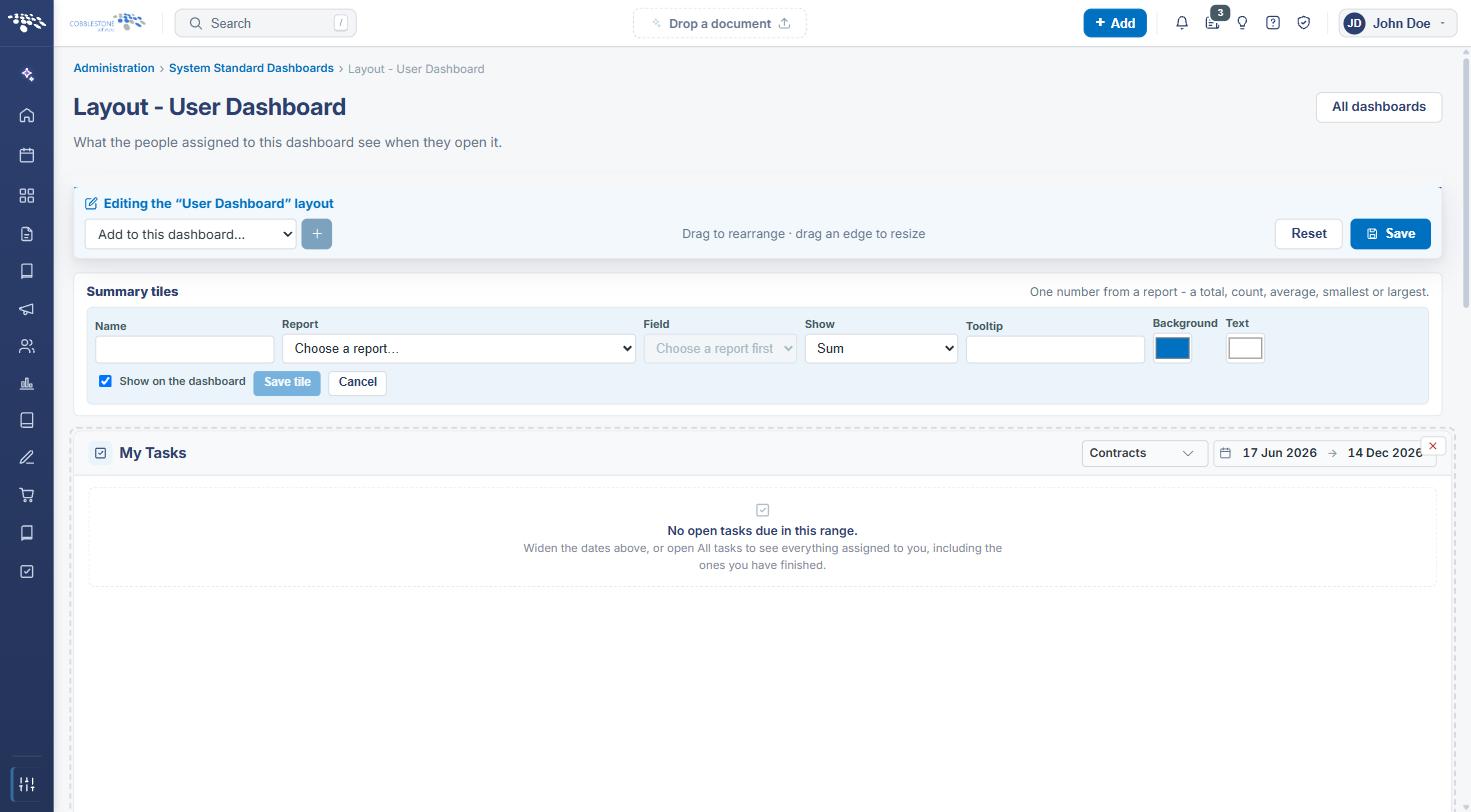
Summary tiles sit in a band at the top of the dashboard, described on the layout page as “One number from a report — a total, count, average, smallest or largest.” Adding or editing one opens an inline editor with these fields:
- Name — the label shown on the tile
- Report — the report the number is drawn from
- Column — the column within that report to summarize
- Show — the calculation applied to the column: Average, Count, Minimum, Maximum or Sum
- Tooltip — optional hover text
- Background and Text — the tile’s colours
- Show on the dashboard — clear this tick box to keep the tile without displaying it
Click Save tile to keep the tile, or Cancel to discard the change. Each saved tile lists its calculation and source beneath its name — for example, “Count of Contract_End_Date · 90 Day Contract Expiration Report”.
5.3 Button Tiles
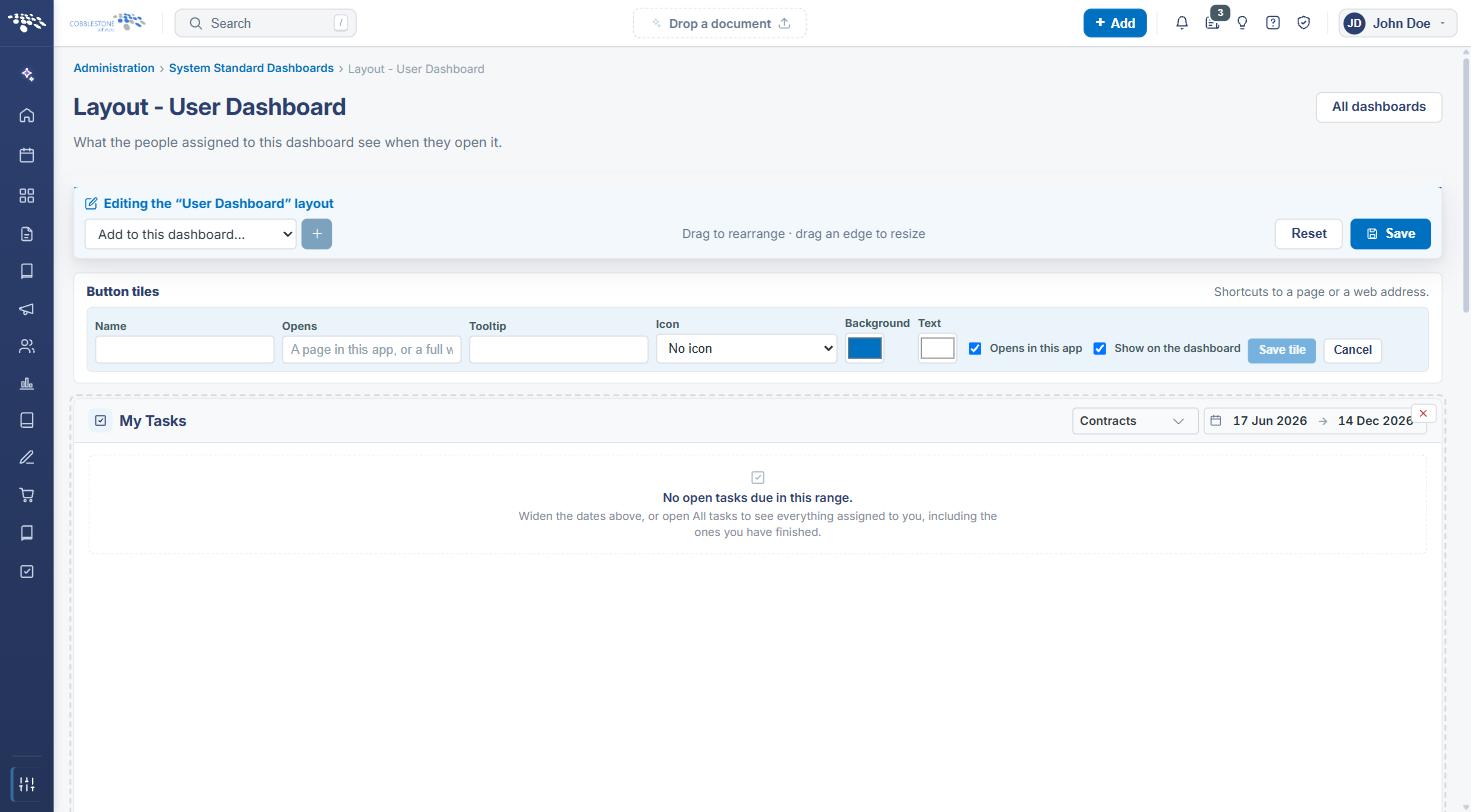
A button tile is a shortcut. Its editor offers:
- Name — the text on the button
- Opens — a page in this app, or a full web address
- Tooltip — optional hover text
- Icon — an uploaded image, or No icon
- Background and Text — the tile’s colours
- Opens in this app — whether the destination opens inside Contract Insight
- Show on the dashboard — clear this tick box to keep the tile without displaying it
6. Assigning a Dashboard to Users
Steps:
- From the Contract Insight homepage, click Administration at the bottom of the left navigation menu. On the Administration page, under Templates & Presentation, select System Dashboards.
- Click Assign on the row for the dashboard. A panel opens headed Assign “<dashboard name>”.
- Choose an Assign by scope: Individual employees (“Only the people you pick see this dashboard.”), Employee role groups (“Everyone in a role group you pick sees this dashboard.”), or Security groups (“Everyone in a security group you pick sees this dashboard.”).
- Use the Search box to find the people or groups you need — the list shows the first 200 entries and notes how many exist in total.
- Tick a name in the ASSIGNED column to give that person or group the dashboard.
- Tick OPENS FIRST beside a name to open this dashboard first when that person signs in.
- Click Save to apply the changes, or Cancel to leave the assignments unchanged.
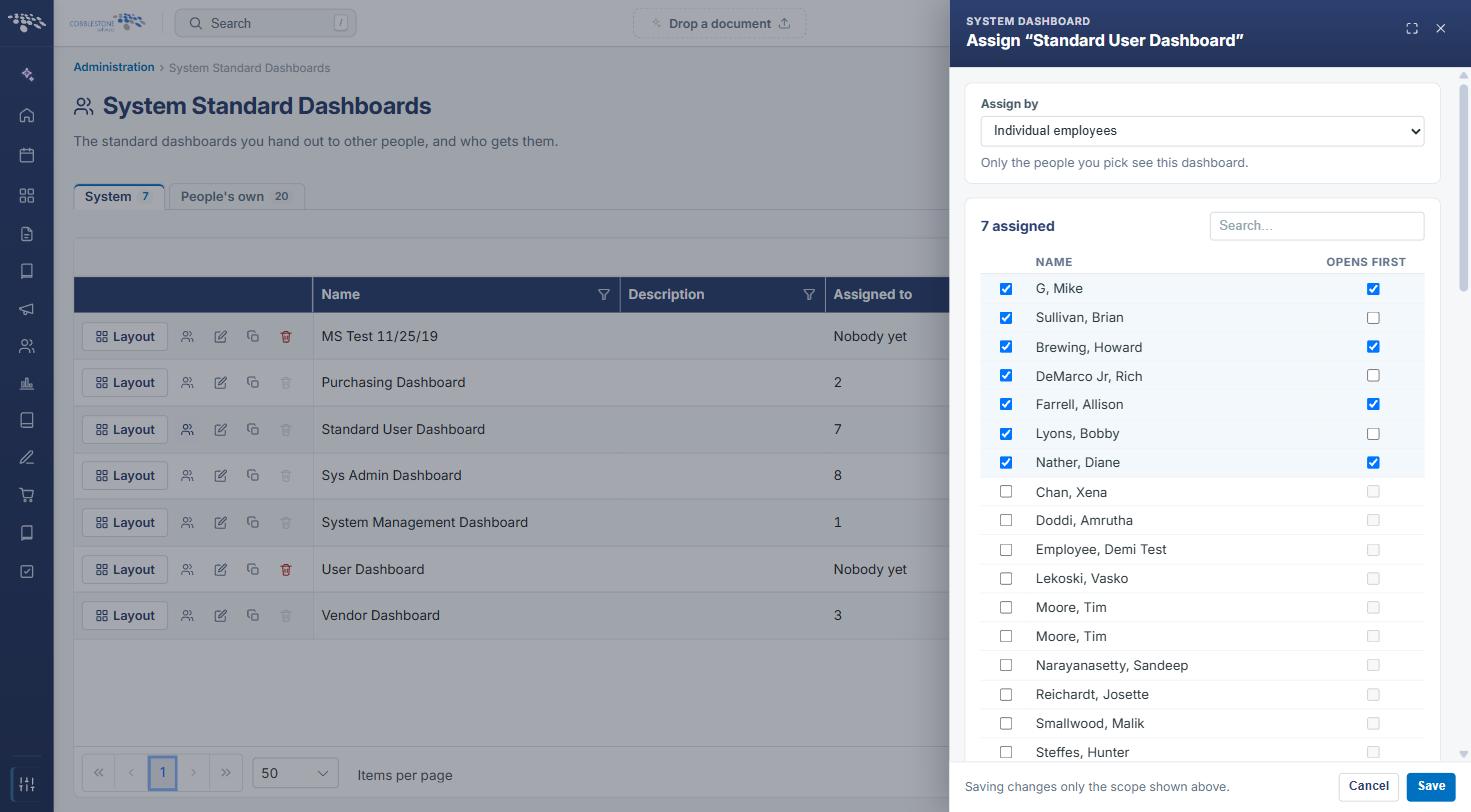
Note: Saving only affects the scope shown in the panel at the time — employees, role groups or security groups. Switch the Assign by scope and save again to change the others. The panel header also shows a running count, such as “7 assigned”.
7. Personal Dashboards and Taking One Over
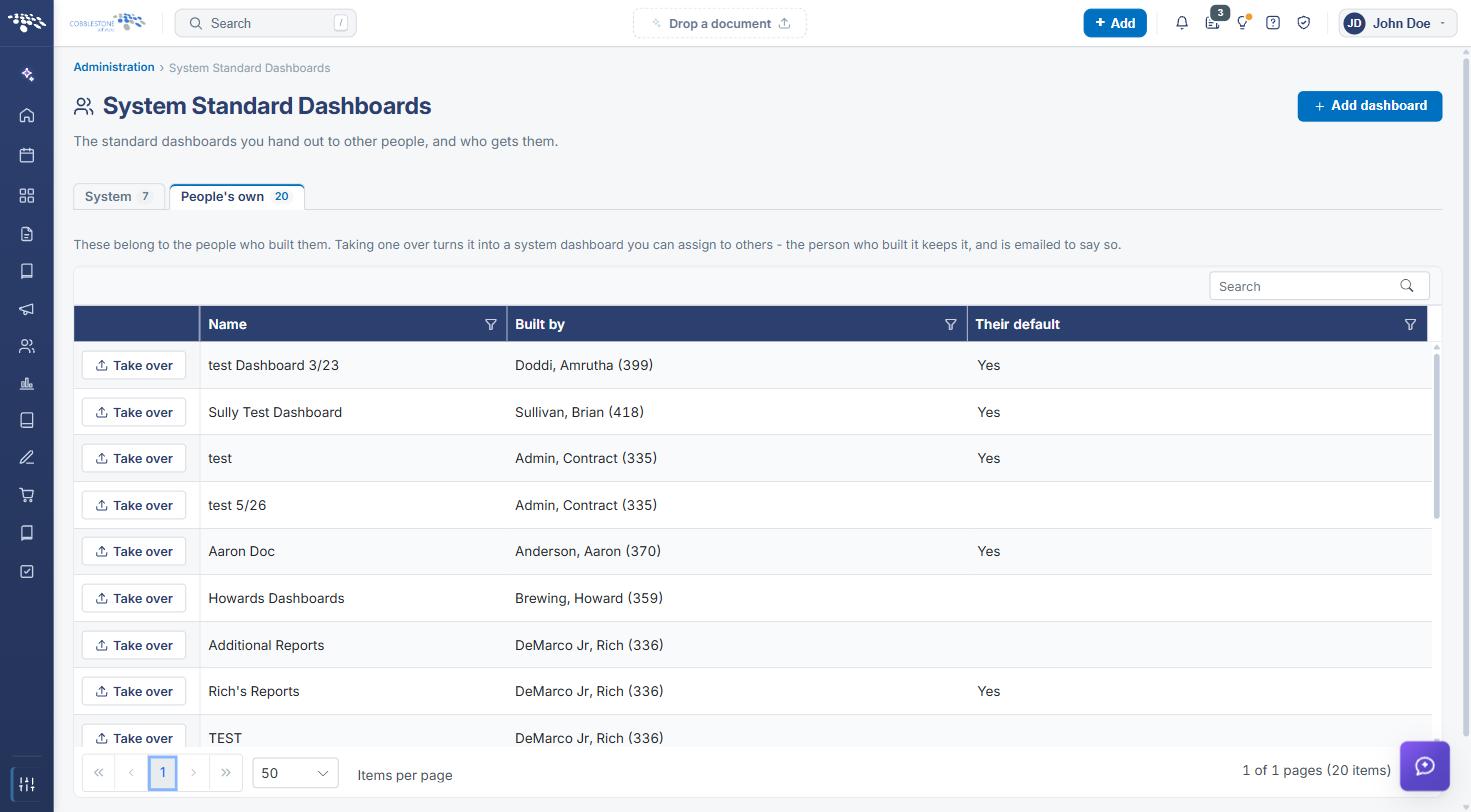
The People’s own tab of the System Dashboards screen lists the dashboards individual users have built for themselves, with Name, Built by and Their default columns. As the screen explains, “These belong to the people who built them. Taking one over turns it into a system dashboard you can assign to others — the person who built it keeps it, and is emailed to say so.”
Steps:
- From the Contract Insight homepage, click Administration at the bottom of the left navigation menu. On the Administration page, under Templates & Presentation, select System Dashboards.
- Click the People’s own tab.
- Locate the dashboard you want, using the Built by column to identify its owner.
- Click Take over on that row. The dashboard becomes a system dashboard on the System tab, where it can be laid out and assigned like any other.
8. Graphical Dashboards (Dashboard Designer)
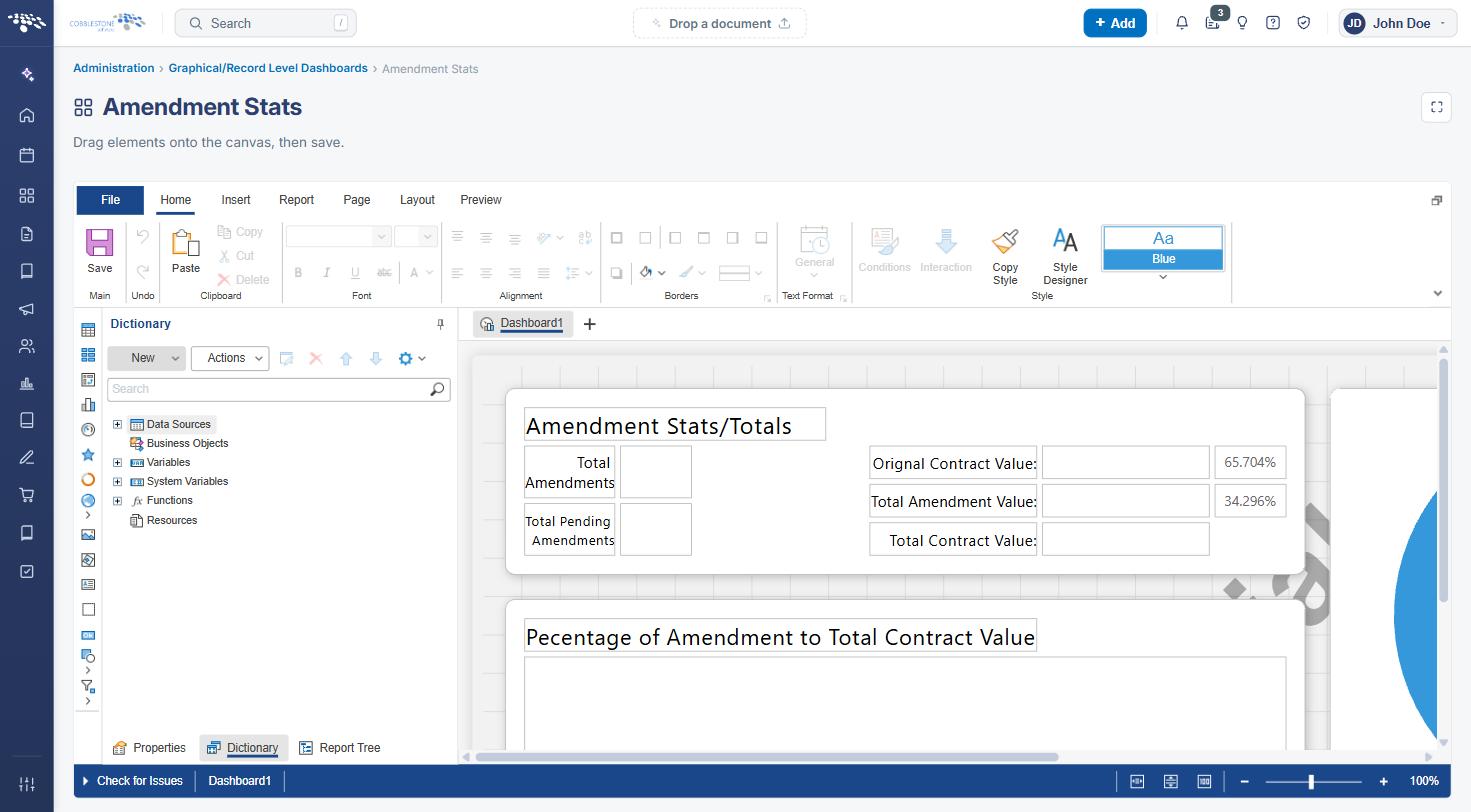
Graphical dashboards are built in a separate tool, reached from Administration under Templates & Presentation by selecting Dashboard Designer. The screen authors the graphical dashboards shown on record dashboard tabs; each widget is scoped to the open record through a {RecordID} token in its SQL, and the application renders the result natively.
Steps:
- From the Contract Insight homepage, click Administration at the bottom of the left navigation menu. On the Administration page, under Templates & Presentation, select Dashboard Designer.
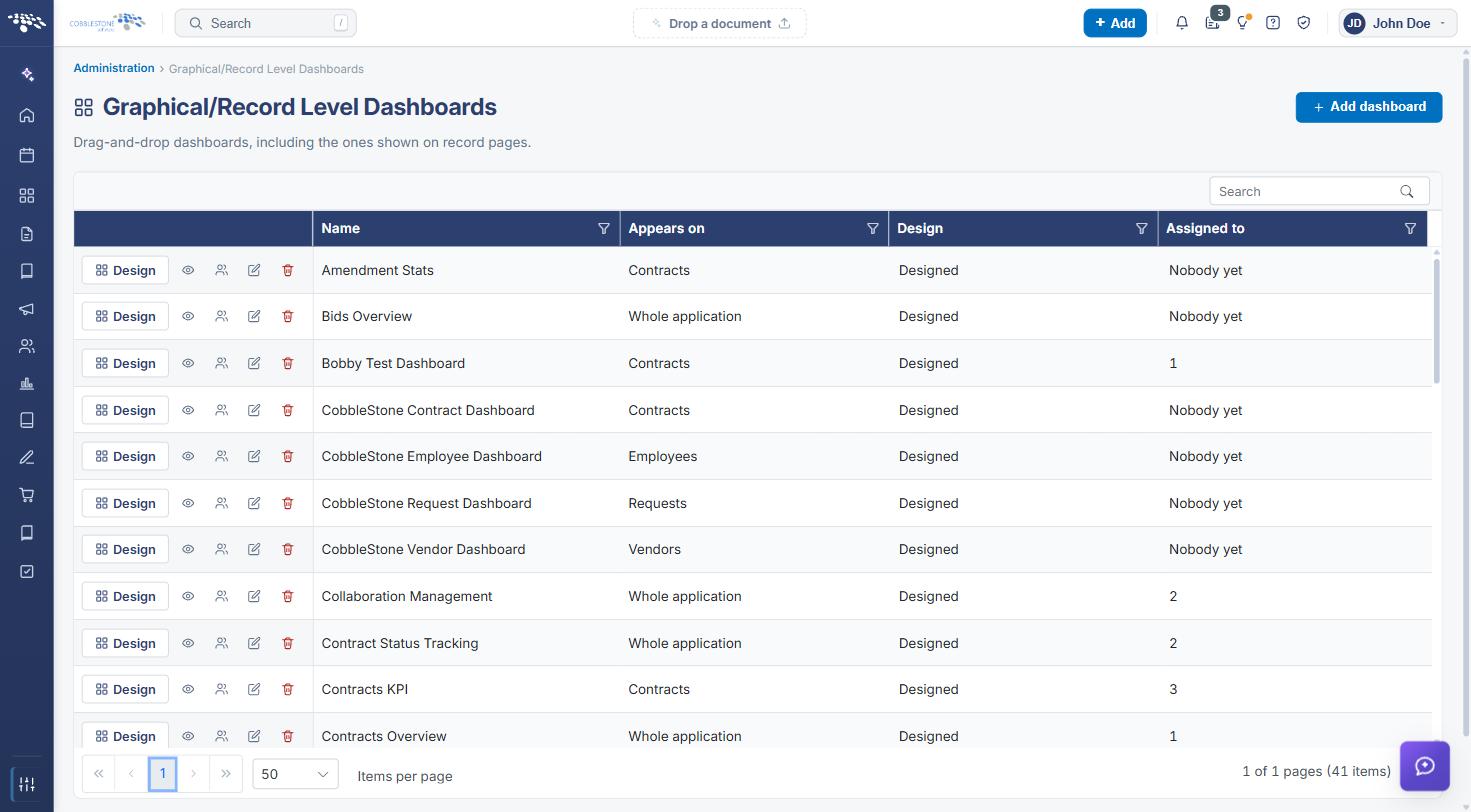
- Click Add dashboard to start a new graphical dashboard, or Edit on an existing row to change one.
- Enter a Name and choose the Area the dashboard belongs to: Contracts, Vendors, Employees, Solicitations, Purchase Orders or Requests.
- For each widget, choose a type — KPI / Indicator, Table, Bar chart or Text — and give it a Widget title.
- Enter the widget’s SQL, using the {RecordID} token to scope it to the open record, then set the Value column and the calculation applied to it (Sum, Count, Average, Min or Max).
- Click Add widget to add another, then Save dashboard to keep the design or Cancel to discard it.
Each row on the Dashboard Designer list shows the dashboard’s Name, Area and Assigned to value, with Edit, Assign and Delete dashboard buttons.
9. Turning Graphical Dashboards On or Off
Function: Controls whether graphical dashboards are available in the application.
Steps:
- From the Contract Insight homepage, click Administration at the bottom of the left navigation menu. On the Administration page, under Configuration & Fields, select Application Settings.
- Search for dashboard, or open the General System category.
- Set Graphical Dashboard — “Enable (True) or Disable (False) the Graphical Dashboard” — to On or Off.
- The related Link to Dashboard setting shows or hides the link to the dashboard in the header user menu.
- Click Save changes to apply the setting, or Discard to abandon it. A change takes effect as soon as it is saved.
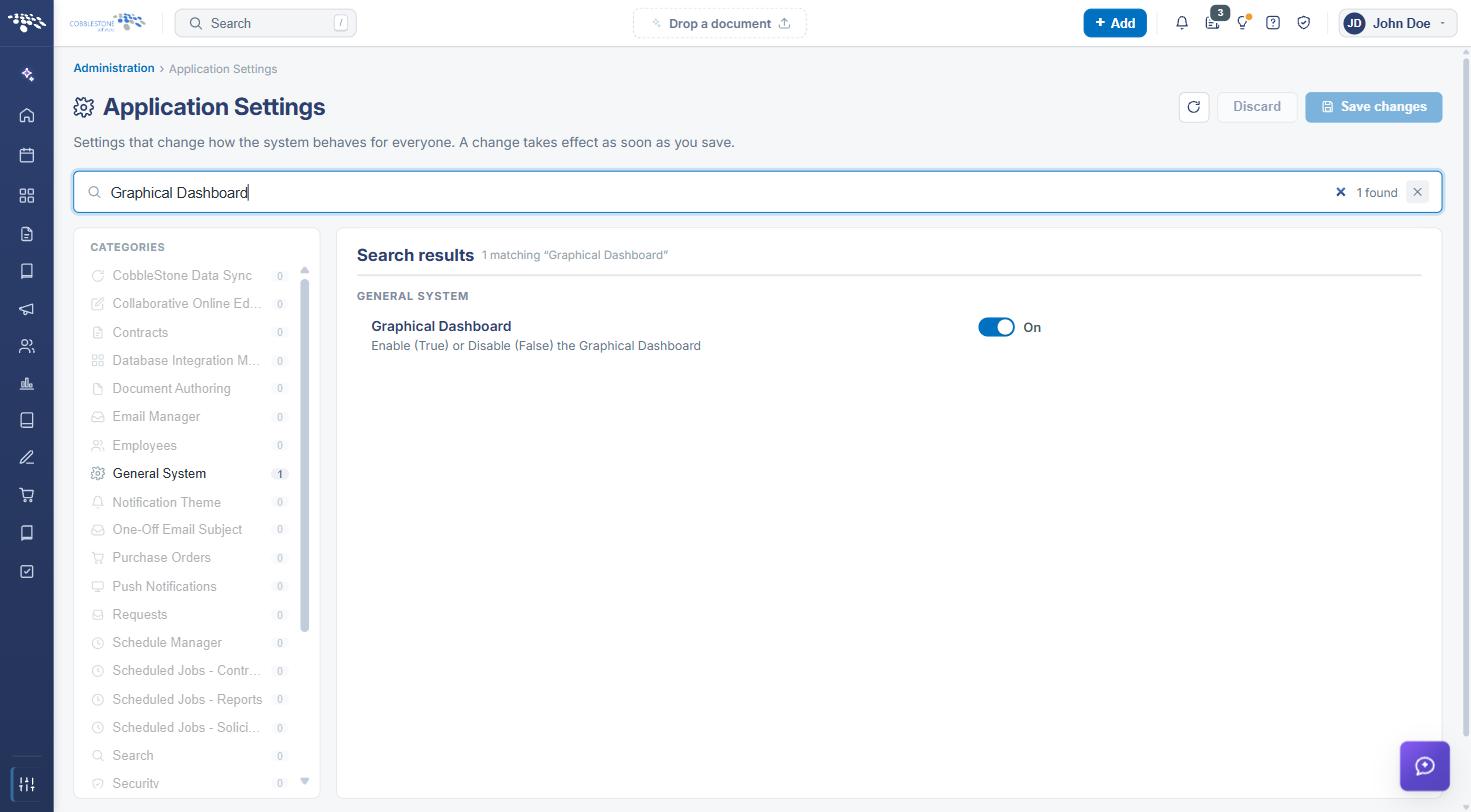
Note: Each setting records when it was last changed and by whom, shown beneath its description.
10. Where People See Their Dashboards
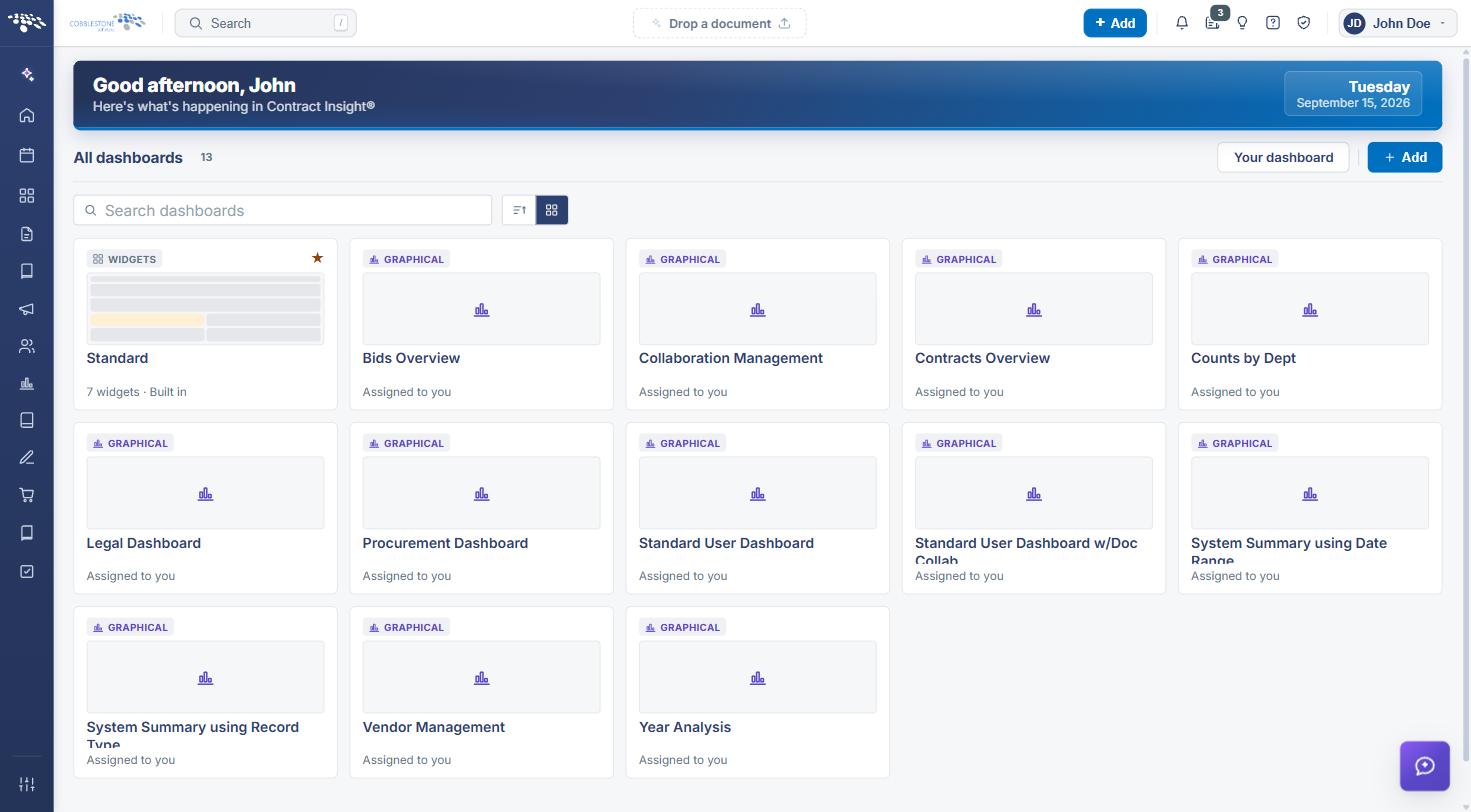
Users open their dashboards from Dashboards in the left navigation menu. The page is subtitled “Every dashboard you can open” and lists every dashboard available to that person:
- Dashboards assigned to them are marked Assigned to you, and graphical dashboards carry a GRAPHICAL label
- The dashboard ticked as OPENS FIRST for that person opens automatically when they sign in
- An Add button lets a user build a dashboard of their own, which then appears on the People’s own tab of the administration screen
11. Quick Reference Summary
Task | How to Complete It |
Open the list | Homepage → Administration → Templates & Presentation → System Dashboards. |
Create a dashboard | Add dashboard, enter the Name, choose the Column split and Where it appears, then Create. |
Add content | Layout on the row, pick an item from Add to this dashboard…, then + Add. |
Arrange content | Drag to rearrange, drag an edge to resize, ✕ to remove, then Done. |
Assign a dashboard | Assign on the row, choose the Assign by scope, tick names, then Save. |
Set the sign-in dashboard | Tick OPENS FIRST beside a name in the Assign panel. |
Edit dashboard details | Edit info on the row — Name, Description and Column split. |
Copy or delete | Copy duplicates the dashboard; Delete is available only once nobody holds it. |
Adopt a personal dashboard | People’s own tab → Take over; the owner keeps their copy and is emailed. |
Graphical dashboards | Administration → Templates & Presentation → Dashboard Designer; enable with the Graphical Dashboard application setting. |