COBBLESTONE SOFTWARE
Contract Insight — User Guide
Graphical Dashboards
05. End Users: Home Page Options › Dashboards › Graphical Dashboards
Note: Each procedure in this guide begins at the Contract Insight homepage, so any section can be followed on its own. Custom fields are configurable, so the exact field list on a contract category record may vary between environments.
1. Overview
A Graphical dashboard displays interactive charts, KPI tiles, and lists built in the dashboard designer, rather than the widget layout of a Widgets (Standard) dashboard. Graphical dashboards are assigned to you by an administrator, so you view and interact with them but don't edit them from the Dashboards page.
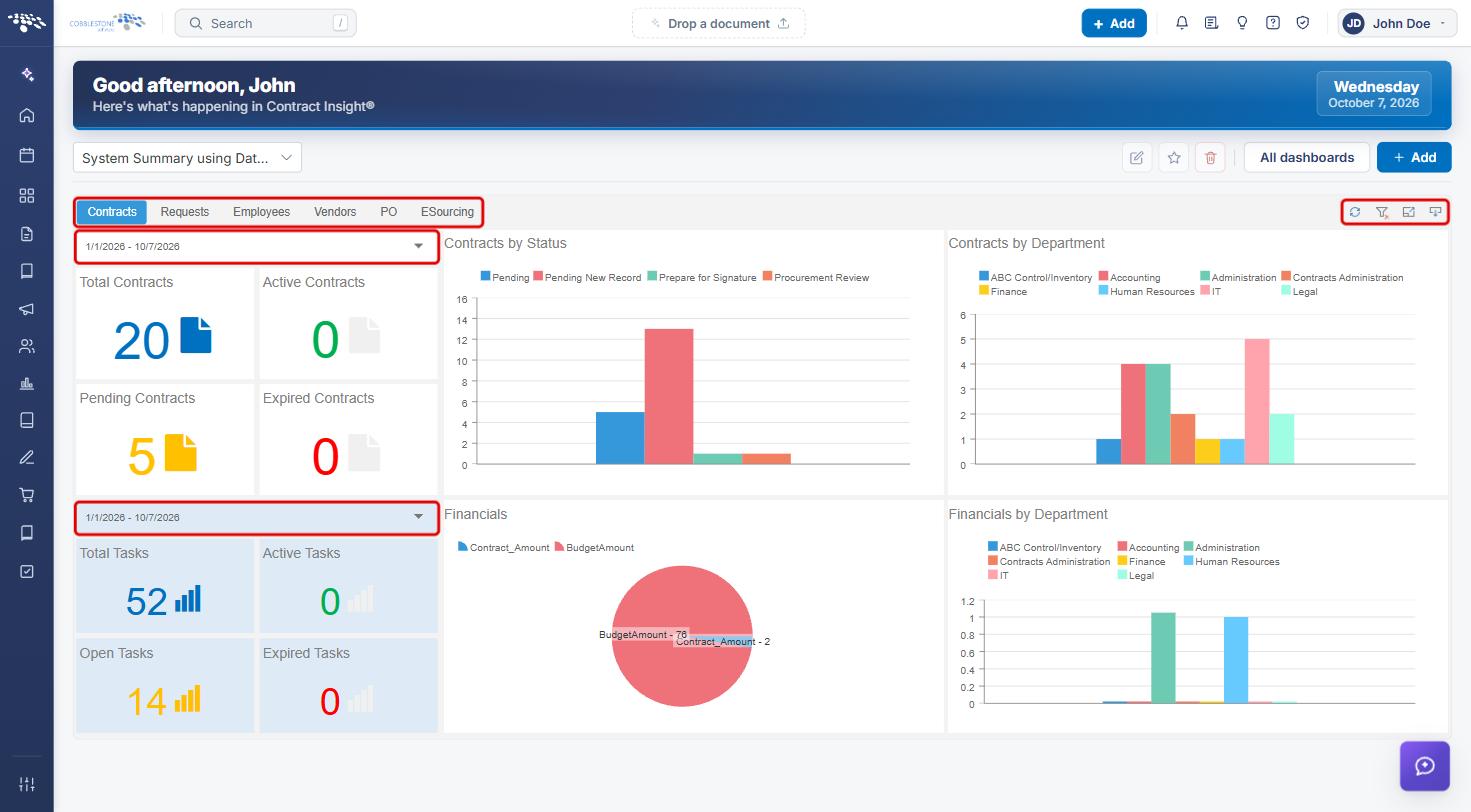
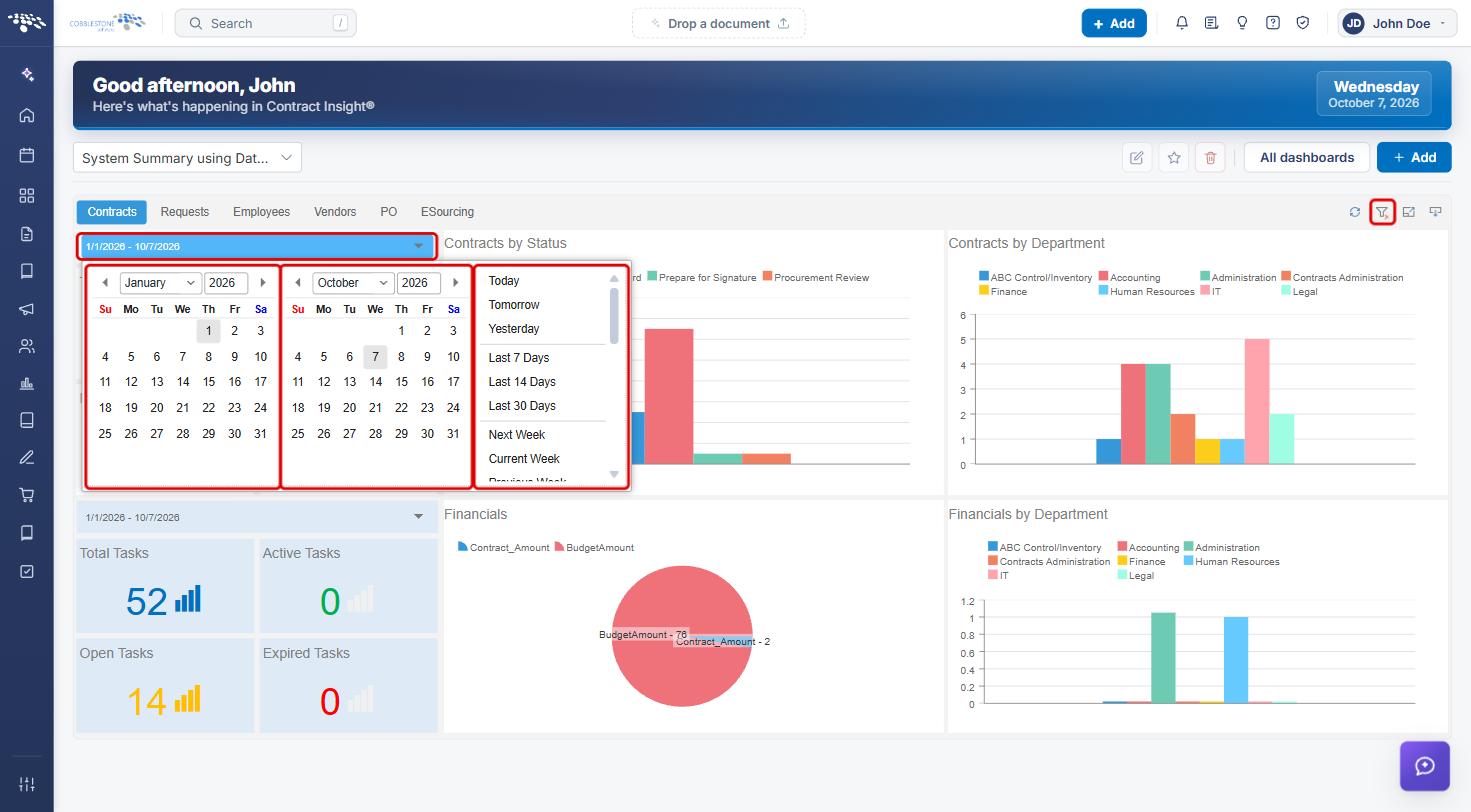
A graphical dashboard can contain several pages, shown as sub-tabs (for example Contracts, Requests, Employees, Vendors, PO, and ESourcing), as well as filters such as date ranges. A toolbar lets you refresh the data, reset filters, view the dashboard full screen, and export it.
2. Key Elements
- All dashboards gallery: cards tagged GRAPHICAL are graphical dashboards; cards tagged WIDGETS are standard widget dashboards. Graphical cards show “Assigned to you.”
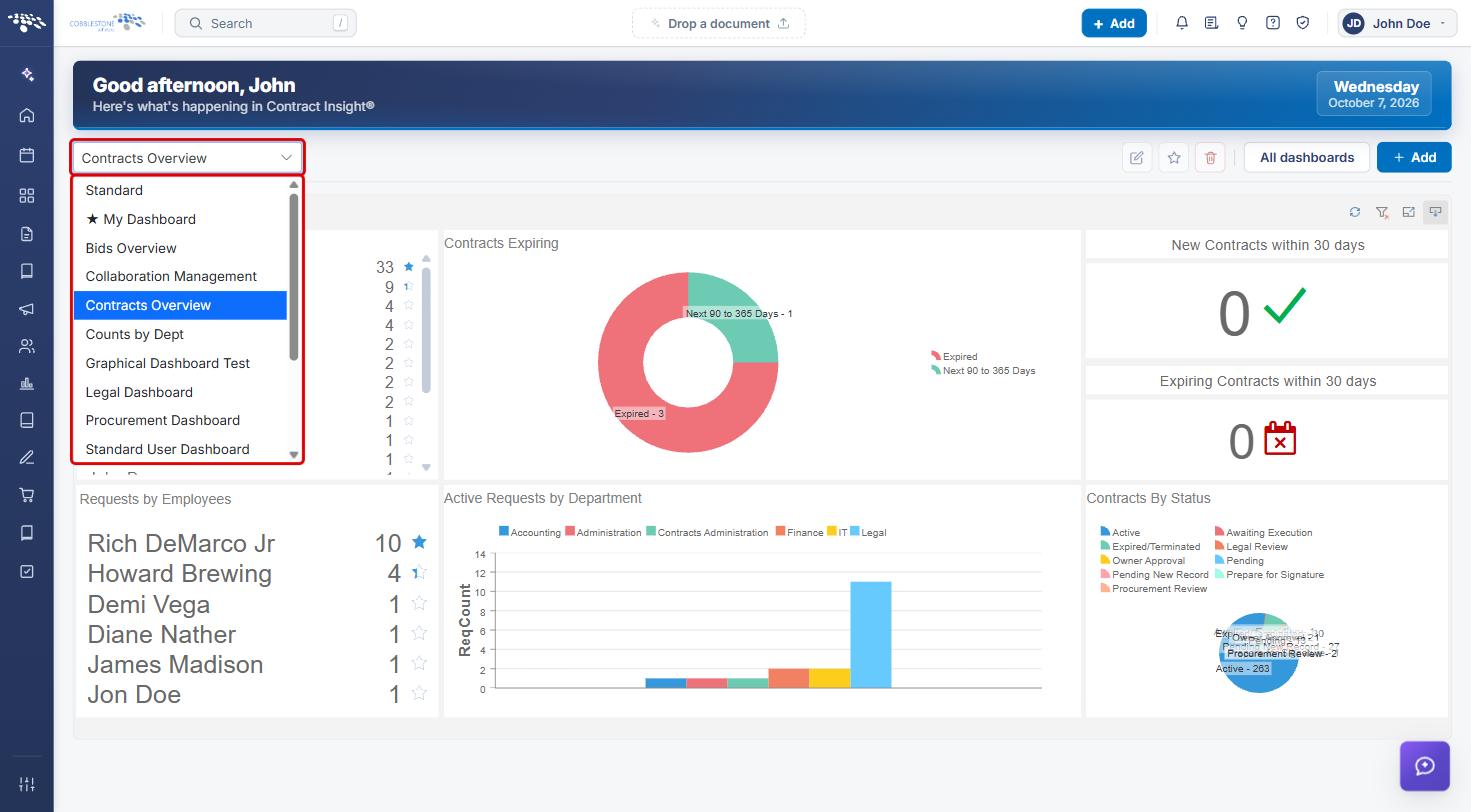
- Dashboard selector: the drop-down at the top left switches between all dashboards available to you.
- Sub-tabs: some graphical dashboards have multiple pages, each on its own tab.
- Filters: elements such as date range pickers narrow the data shown in the related charts and tiles.
- Toolbar (top right of the dashboard): Refresh, Reset All Filters, Full Screen, and an export menu (Report Snapshot, Adobe PDF, Microsoft Excel, HTML, and Image).
- The edit, favorite, and delete icons in the header are unavailable for graphical dashboards. Administrators change graphical dashboards under Administration, and they are deleted in their own designer.
3. Opening a Graphical Dashboard
- From the Contract Insight homepage, click All dashboards, or click the Dashboards icon in the left navigation bar.
- Find the dashboard in the gallery. Graphical dashboards are tagged GRAPHICAL. Type in Search dashboards to filter the list.
- Click the dashboard card to open it.
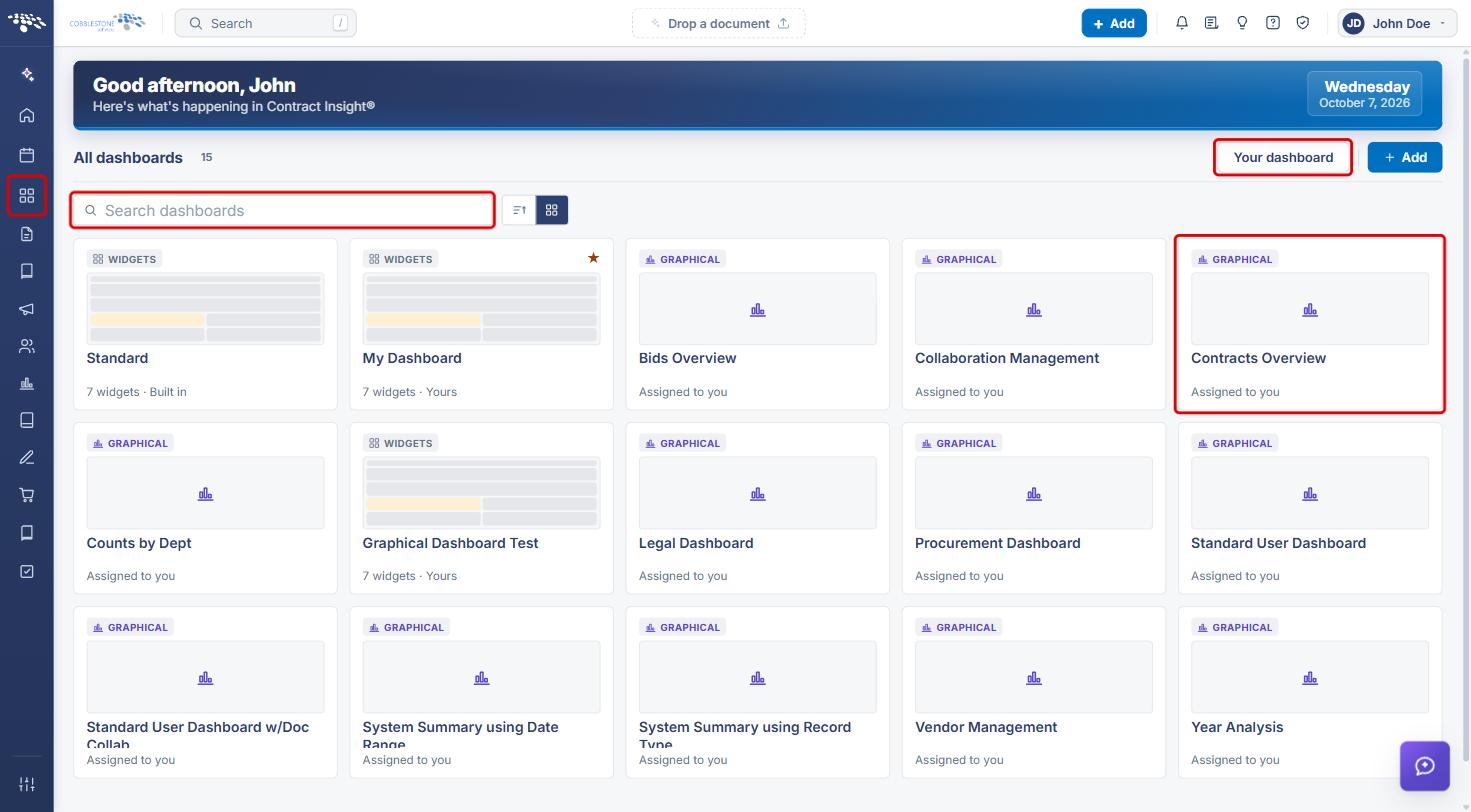
Note: Click Your dashboard to return to your default dashboard.
4. Switching Between Dashboards
- With any dashboard open, click the dashboard selector at the top left.
- Select another dashboard from the list. Graphical and widget dashboards both appear here.
5. Using the Dashboard Toolbar
The toolbar sits at the top right of the dashboard area.
- Refresh (circular arrows): reloads the dashboard data.
- Reset All Filters (funnel): clears any filters you've applied and returns charts to their default view.
- Full Screen: expands the dashboard to fill the screen.
- Export: opens a menu to save the dashboard as a Report Snapshot, Adobe PDF, Microsoft Excel, HTML, or Image file.
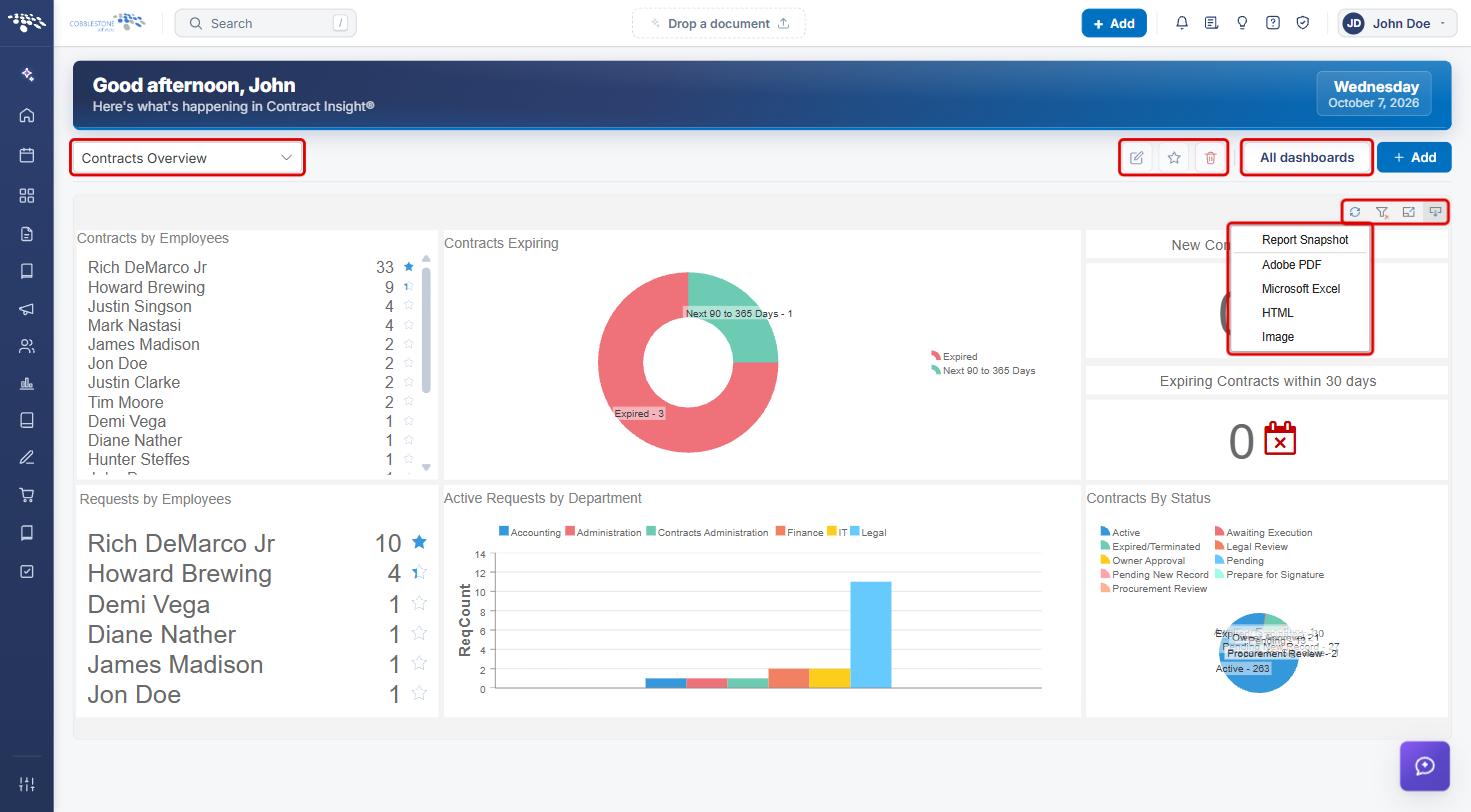
Note: The edit, favorite, and delete icons in the header are greyed out for graphical dashboards. Hover over each one to see why.
6. Navigating Sub-Tabs and Filters
- If the dashboard has multiple pages, click a sub-tab (for example Contracts, Requests, or Employees) to switch pages.
- To change a date range filter, click the filter bar to open the picker.
- Choose a start date in the left calendar and an end date in the right calendar, or pick a preset such as Today, Last 7 Days, Last 30 Days, or Current Week.
- The related tiles and charts update to the selected range. Click Reset All Filters in the toolbar to return to the defaults.
7. Quick Reference Summary
| Task | How to Complete It |
|---|---|
| Open the dashboards gallery | Homepage → All dashboards (or the Dashboards icon in the left navigation bar). |
| Open a graphical dashboard | Click a card tagged GRAPHICAL. |
| Switch dashboards | Dashboard selector (top left) → choose a dashboard. |
| Change pages | Click a sub-tab at the top of the dashboard. |
| Filter by date | Click the date range bar → choose dates or a preset. |
| Clear filters | Toolbar → Reset All Filters. |
| Refresh data | Toolbar → Refresh. |
| View full screen | Toolbar → Full Screen. |
| Export the dashboard | Toolbar → Export → Report Snapshot, Adobe PDF, Microsoft Excel, HTML, or Image. |
| Return to your default dashboard | All dashboards → Your dashboard. |