System Dashboards
AppConfig: System Dashboards
System Dashboards allow system admin users to build and specify Dashboards for users to ensure those users see and have access to reports and other docks created.
To manage System Dashboards, navigate to Manage/Setup > Application Configuration > System Dashboards.
.png)
To add a new System Dashboard, click Add New Dashboard.
.png)
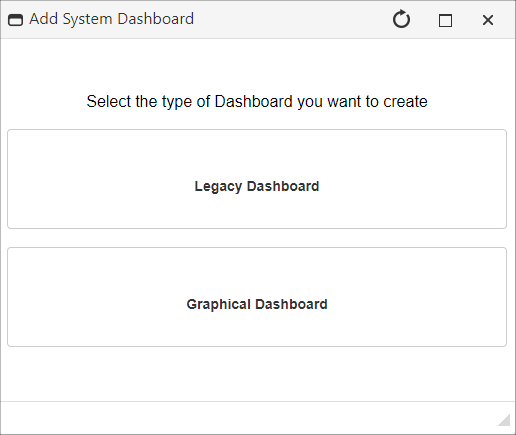
A pop-up window displays. Select the type of dashboard to create, Legacy Dashboard or Graphical Dashboard.
Creating a Legacy Dashboard
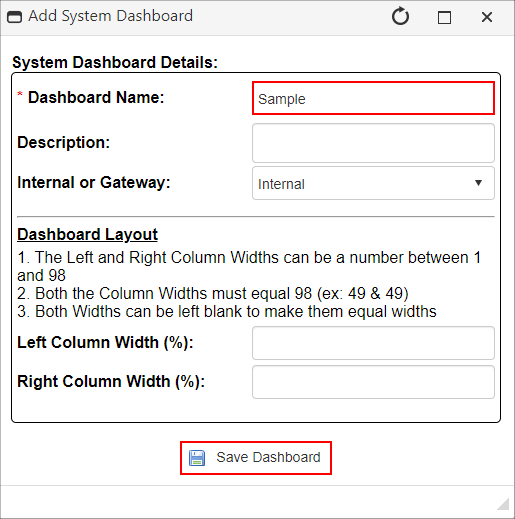
Name the System Dashboard and optionally give it a Description. To have the Dashboard to be split into two even columns, leave the Dashboard Layout section blank. To have the dashboard appear as one full screen column, set the Left Column Width (%) to 98. To have two uneven columns, enter number values needed and ensure they add up to 98. Click Save Dashboard to save the new System Dashboard.
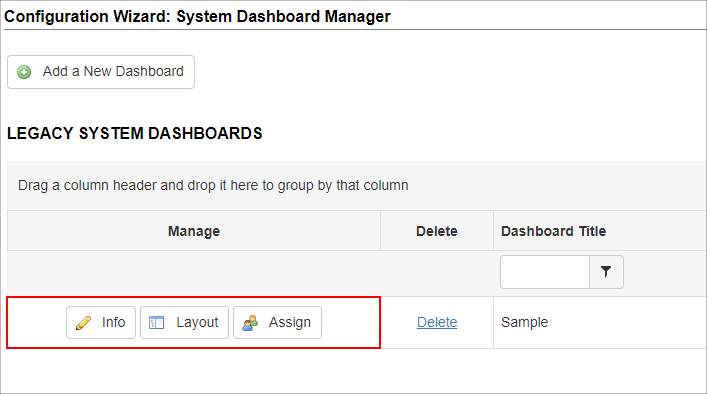
The page refreshes and the new System Dashboard is added to the list. Click Info, Layout, or Assign to manage the System Dashboard, or click Delete to remove it. Clicking Info reopens the System Dashboard Details screen.
Click Layout to open the Dashboard so as to assign Docks to it. Click Add New Dock to proceed or click System Dashboards to go back to the list.
.png)
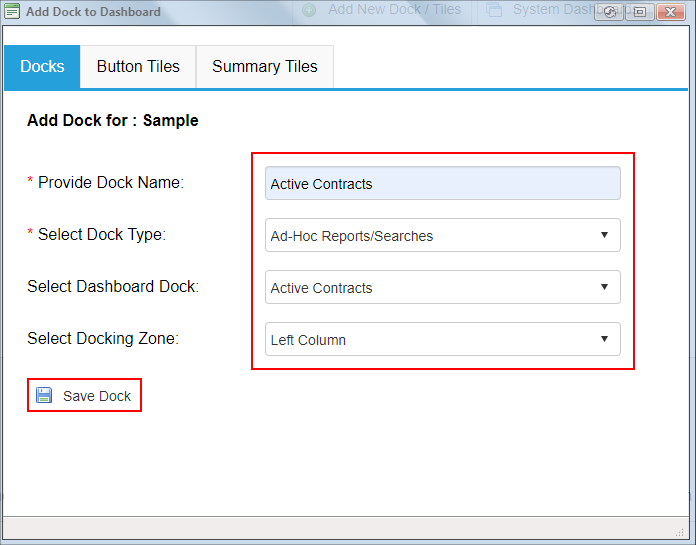
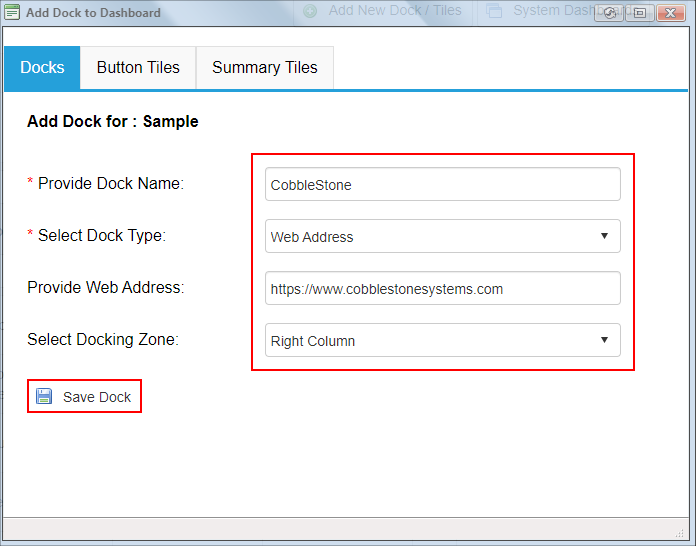
After providing the Dock Name and Dock Type, the window adjusts accordingly. If Ad-Hoc Reports/Searches is selected for the Dock Type, a drop down appears for the selection the report. If Web Address is selected, a text box in which to type in the Web Address appears.
Note: that the Web Address must be full, including https://www.
Also, not all Web Addresses are guaranteed to work, as it is dependent on the external website allowing itself to be placed in an IFrame.
In the example below, the Ad-Hoc Report was placed in the Left Column and the Web Address in the Right Column.
.png)
STIMULSOFT GRAPHICAL DASHBOARDS
The Stimulsoft Dashboard presents a top-in-the-class kind of modern dashboard with graphical elements to provide valuable information to the user at a glance. This dashboard can be used to compare various fields, show summary of various fields, etc.
Using the Stimulsoft Dashboard is like using the Stimulsoft Report in CobbleStone®.
Note: Just like the Stimulsoft Reports, Dashboards generated with this tool will not enforce Application User Permissions without the appropriate filters defined within the Dashboard. Hence, only System Admins can create new Dashboards.
To Create a New Graphical/Stimulsoft Dashboard:
1. Click on Add New Dashboard.
2. Choose Graphical Dashboard.
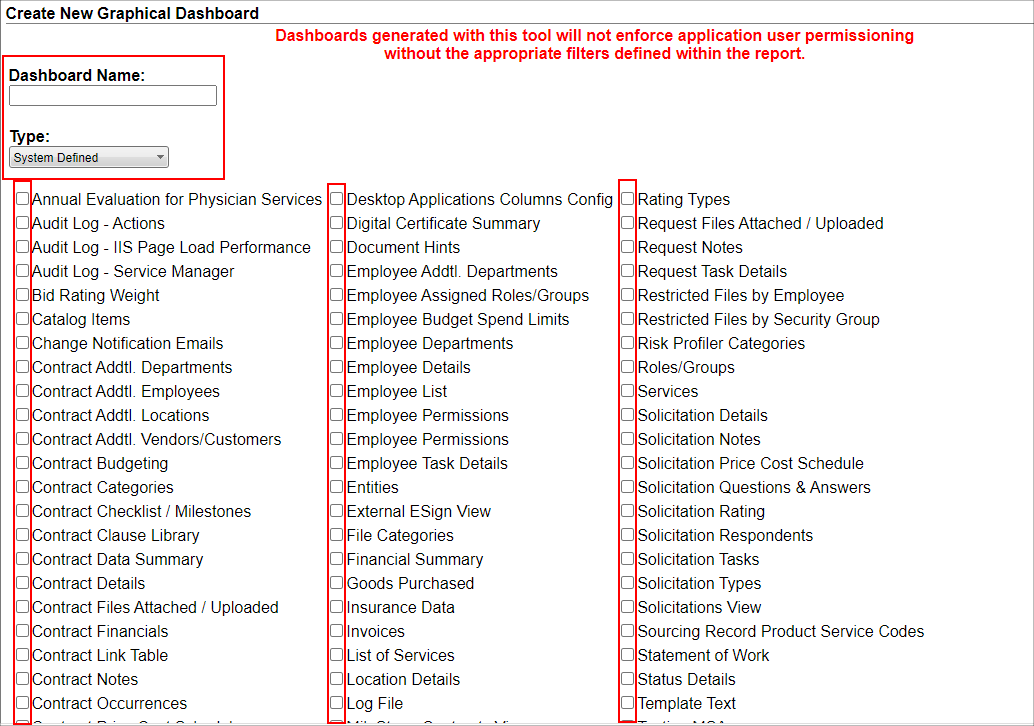
3. Enter/ select the following
A. Enter a name for the dashboard
B. Select the data source type, system defined or ad-hoc report
C. choose the various sections from which the data is to be collected for the Dashboard
D. Enter a description for the Dashboard.
4. Click Create Dashboard.
5. The Dashboard Designer page displays. Focus your attention to the left side.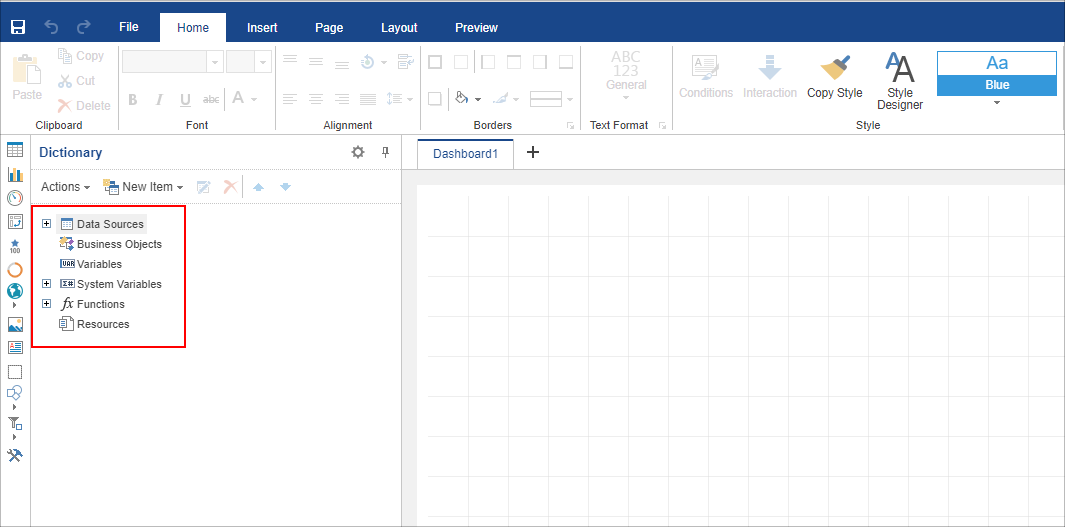
6. Expand the Data Sources to reveal all your fields.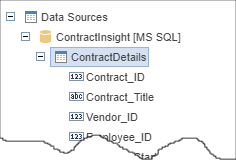
7.Go to the Insert tab and click the type of Graphical chart you need.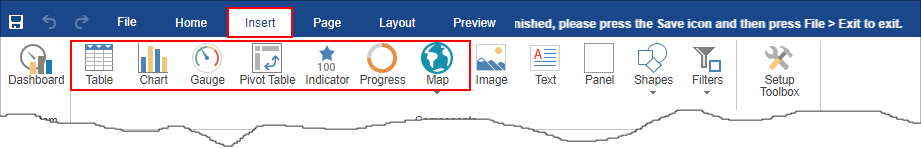
8. Once you click on one of the elements, go to the Design board and click where you want the graph to appear. The chart should appear where you clicked with a Drag & Drop data from dictionary box with it.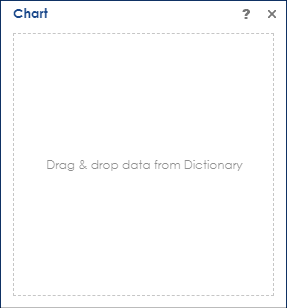
9. Drag fields from the left side menu Data Sources to the box for Value, Arguments, and Series.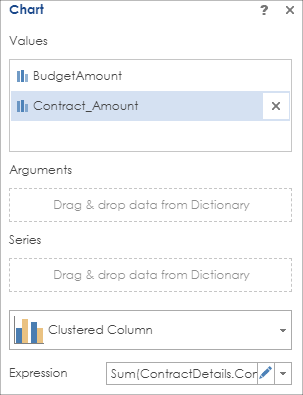
10. Enter a custom expression by clicking the Edit icon on the Expression field (the last field in the box). The area expands for the entry of a custom expression.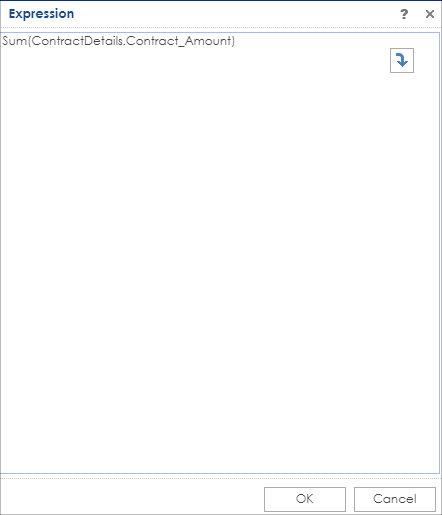
11. Click Close in the expression box. If desired, resize the Graphical Element in the Designer view.
12. Repeat steps 7 to 11 for other needed graphical elements.
13. Once finished with the design, press the Save icon and then press File > Exit to exit the Stimulsoft Dashboard Designer.
14. The next screen will show the various details about the dashboard. At this screen, assign the newly created dashboard to the users (including the creator of the dashboard). This is because the dashboard won’t take user permissions into consideration.
15. You have created a Graphical Dashboard!
CONFIGURATION of Graphic Dashboards
Admins may choose to Disable / Enable this feature in their system. To do so, go to :
1. Navigate to Manage Setup > Application Configuration > Config Settings
2. In the Configuration Group drop-down box, select General System.
3. The Setting Graphical Dashboard is available to enable or disable Graphical Dashboards for users.
Assigning a Dashboard to Users
Click System Dashboards to go back to the list, then click Assign to assign the dashboard to users, user groups, and/or security groups.
.png)
Using the pop-up window, move Employees, Employee Groups, and/or Security Groups from the left to the right, assigning them to the System Dashboard. Select the assignment type from the pick-list at the top of the window. Select the individuals or group, and click the right-facing arrow. Once assigned, they will be able to access the System Dashboard via their Dashboards. Note the added Default Dash functionality that appears once assigned; if set to Yes, the System Dashboard will always be the first thing the User sees upon login; they will not be able to change that unless they are also a System Admin. Click Save Assigned Employees to finish System Dashboard configuration.
.png)
For more information, please see the manual attached to this wiki article.