Session Performance
Session Performance, Reporting, & Profiling
When evaluating performance, it is important for System Administrators to have the ability to see exactly how many actions are being taken by an employee over a certain period. It is also vital to see how quickly and efficiently the CobbleStone® system is running. With Session Performance, Reporting and Profiling, this allows for transparency in these areas, as well as troubleshooting capabilities.
To access Session Performance, click Manage/Setup, Application Configuration, and Initial Setup. Under the App Management side menu, click Session Performance.
.png)
.png)
The first names, last names, initial action, last action, action count, and more are all listed here. This allows System Administrators to view who exactly is acting, when they are acting, and how many actions they are taking.
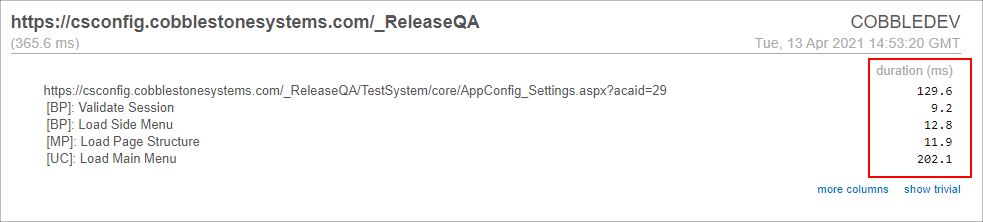
In the Session Performance Monitor, we have some very valuable tools available. For one, we can click the carrot to see system response times in seconds. When View is clicked, this gives us a breakdown of the time (in milliseconds) the page took to open, consisting of items like validate session time, load main menu time, and more.
Configuring the Session Performance Manager
Out of the box, the Session Performance manager is defaulted to Active=False. In order to configure this to Active=True, click Manage/Setup, Application Configuration, and Config Settings.
.png)
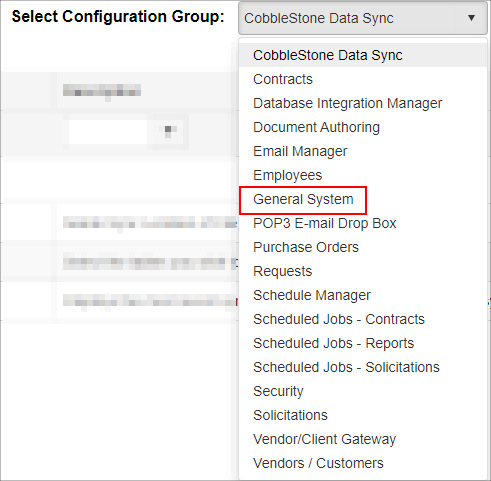
Then from the Select Configuration Group dropdown box, select General System.
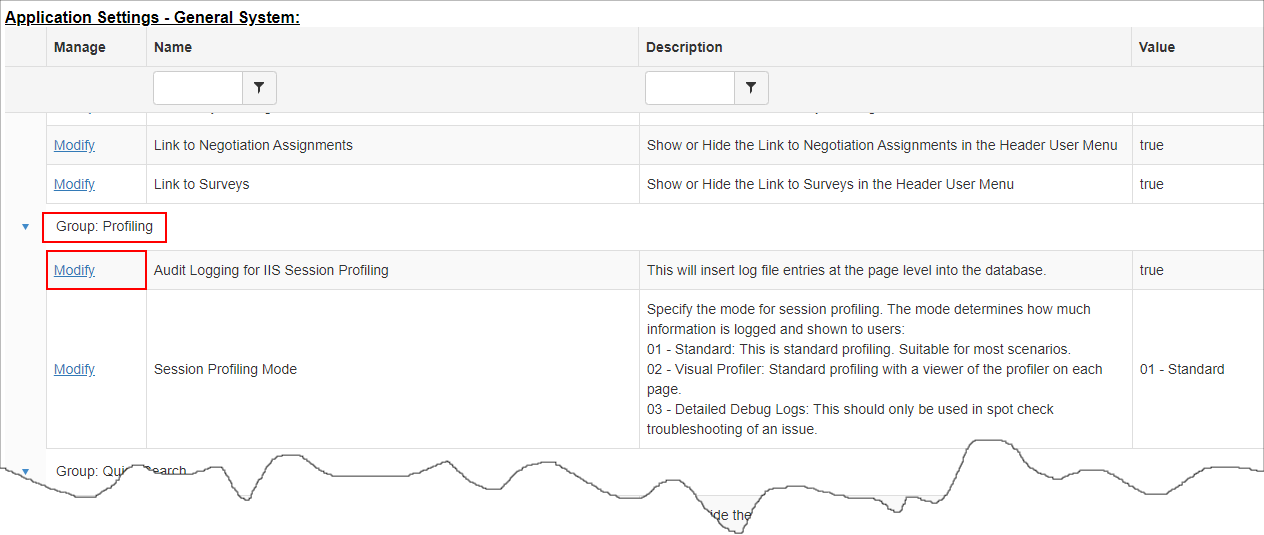
Scroll down to Group: Profiling and click Modify next to Audit Logging for IIS Session Profiling.
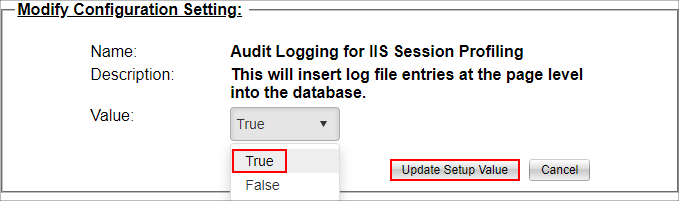
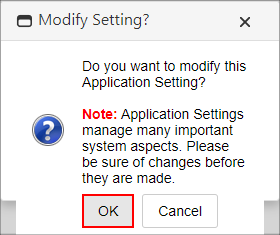
A prompt will appear, asking you if you are sure you want to modify this Application Setting. Click OK to advance.
In the Value dropdown box, select True from your allotted choices, and click Update Setup Value to apply the change. Now Session Performance will be available as an additional tool at the user’s disposal.