CobbleStone® University Certification Program - Unit 2
Ad-Hoc Report Wizard: Overview
Ad-Hoc Report Wizard: Overview
Advanced Ad-Hoc Reporting within Contract Insight is managed through the use of an easy to use on the menu list under Ad-Hoc Report Wizard header. Ad-Hoc Reports are the primary reporting tool in CobbleStone® Contract Insight and can be created to represent most metadata tracked in CobbleStone®. Reports can be managed by System Administrators and Users with the proper permissions. Below is a detailed breakdown of the components of this wizard.
Accessing the Ad-Hoc Report Wizard
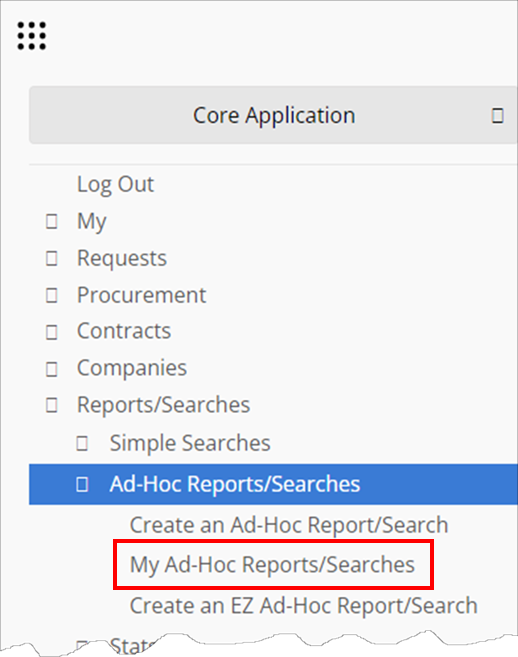
1. Navigate to Reports/Searches - Ad-Hoc Reports/Searches - My Ad-Hoc Reports/Searches.
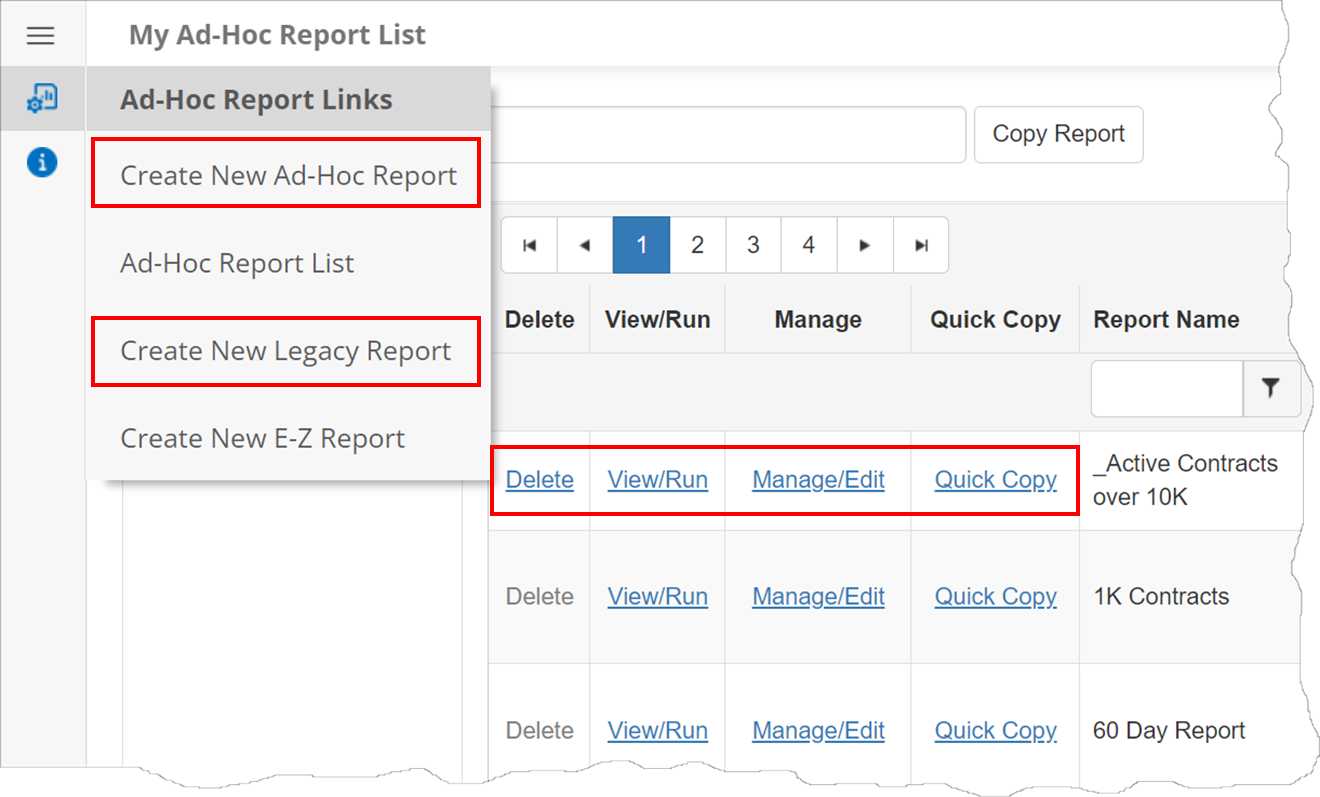
2. My Ad-Hoc Report List displays. On the side menu, click Create New Legacy Report.
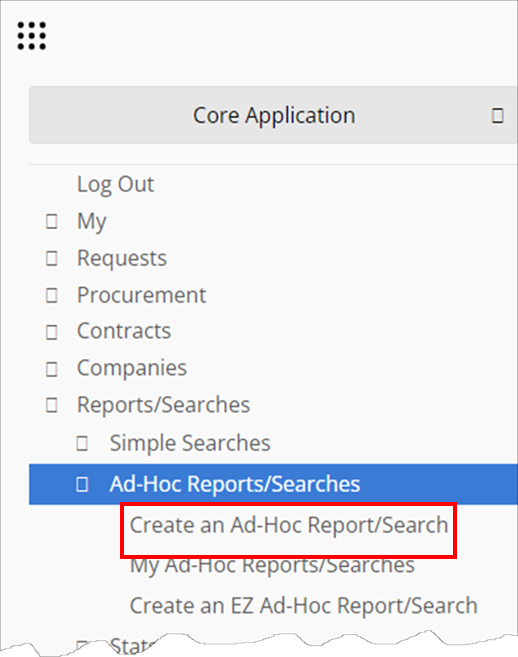
Alternatively, navigate to Reports/Searches - Create an Ad-Hoc Reports/Search to advance immediately to the Overview screen.
Note: Several Ad-Hoc Reports come out-of-the-box, but an unlimited amount of reports can be created.
Ad-Hoc Report Wizard
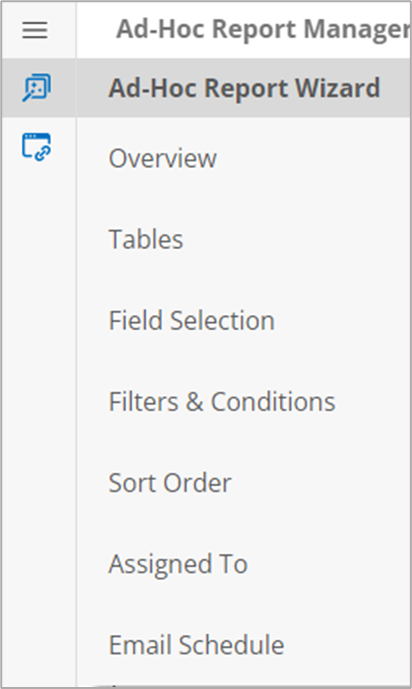
Building an Ad-hoc Report involved going through the 7-step Ad-hoc Report Wizard. The wizard displays on the side menu. Click each step as necessary (being sure to save all changes before moving on).
1. Overview: The initial page in the creation of an Ad-Hoc Report to provides overview information for the report.
2. Tables: The second page is used to select the tables used in the report.
3. Field Selection: The third page is used to specify/select what fields from the table(s) selected in step 2 are to be used for this report. All fields may be reported on.
4. Filters & Conditions: The fourth page provides the ability for granular filtering and conditions to be applied to the report.
5. Sort Order: The fifth page in the wizard allows for one or more fields selected in step 3 to be assigned as a default or starting sort order.
6. Assigned To: The sixth page is used to decide which Employees/Users can be assigned to view/run this report.
7. Email Schedule: The final page in the wizard provides the ability to configure an e-mail schedule for sending out this report to the Employees/Users assigned. System Admins, End Users, and Employees (even those who are not users) can receive Ad-Hoc Reports via email.
Ad-Hoc Report Links
Create New Ad Hoc Report: This link opens a blank wizard starting at step 1 - Overview & Tables for the creation of a new Ad-Hoc Report. Only System Admins and those with proper missions may create Ad-Hoc Reports.
Ad Hoc Report List: This link goes back to the list of Ad-Hoc reports (showing those reports the Employee/User Account has access to view).
Create New Legacy Report: This link opens a blank wizard for a Legacy Ad-Hoc Report.
View/Run This Ad Hoc Report: This link opens the page that executes and displays the results of the Ad-Hoc Report currently being viewed.
To watch more about Ad-Hoc Reporting (both Legacy AND Standard), please watch the following two (2) videos.
Dashboard Manager
Dashboards: Manager
The dashboard manager provides a list of all of the dashboards a user has configured for him or herself along with the ability to manage/edit or delete them. System Administrators and User with proper permissions can create their own My Dashboards. Only System Administrators can create/manage System Dashboards.
Creating a Dashboard:
1. Select Dashboards Mgr. from the My top menu option.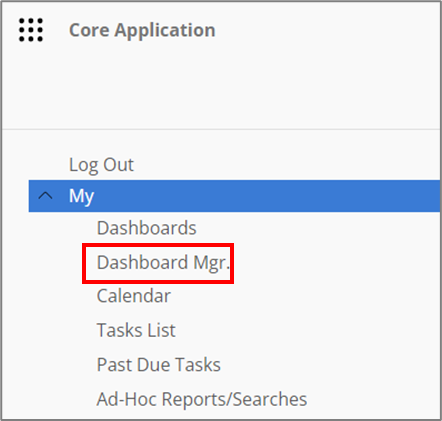
2. The My Dashboard Manager screen displays. Click Add New Dashboard from the side menu.
NOTE: This will create a personal dashboard. System Admins and those with permissions are free to create personal dashboards.
OR
Click the Manage/Setup dropdown, then Application Configuration, and System Dashboards to create System Dashboards. System Dashboards may only be created by System Admins. These dashboards may be assigned to any user in the system.
3. Choose the dashboard type.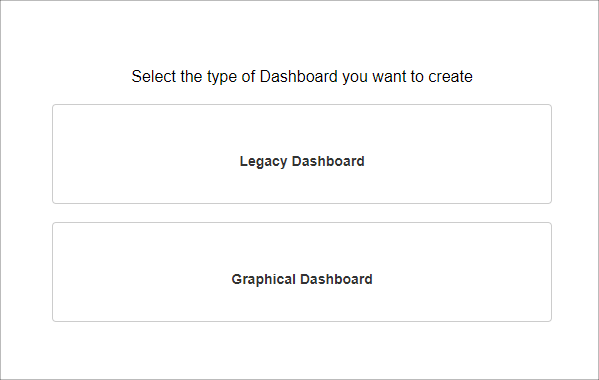
4. Provide the required information.
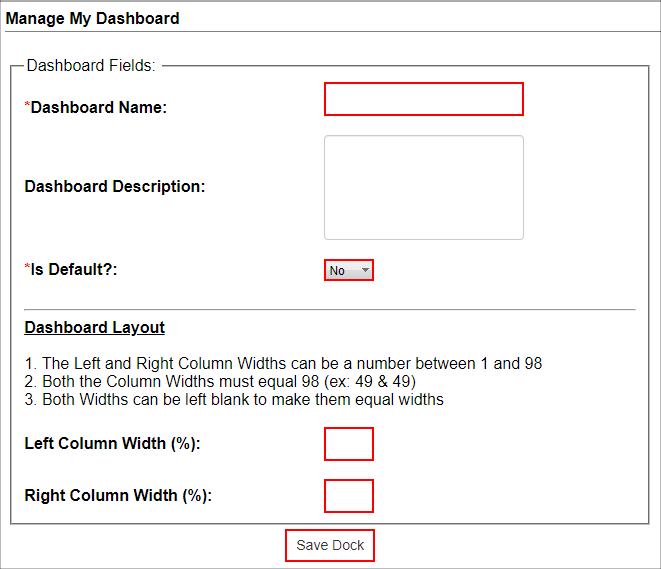
Note: The My Dashboards page will initially display your default dashboard. When creating your dashboard, you can select whether the dashboard is default or not by using the Is Default drop down item. All other dashboards will be available from the dashboard drop down menu on the My Dashboards page (see the My Dashboards page of Wiki).
5. Click Save to return to the My Dashboard Manager screen where a list of your dashboards (including the newly created dashboard) displays.
6. To configure your dashboard once it has been created and saved, you can add Docks (See the Docks page of Wiki).
7. My Dashboard Manager is accessible from several different screens as well on the side menu.
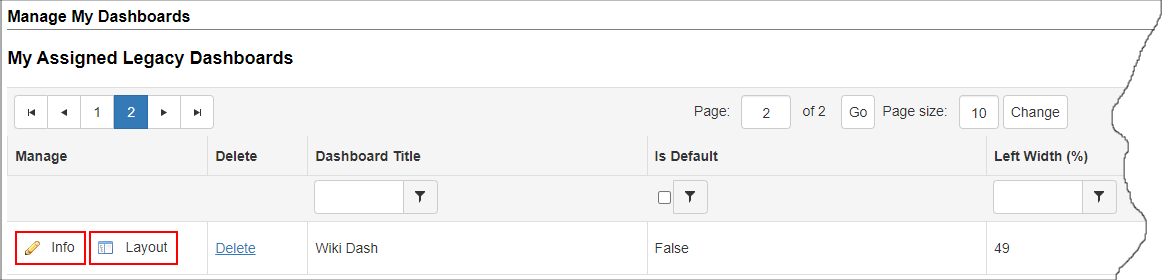
To Change/Manage your Dashboard:
Click Info or Layout for the dashboard to modify.
The Info screen will look exactly like the screen where you first created the dashboard. Be sure to click Save to save any changes.
The Layout screen will allow the user to add Docks, Button Tiles, and/or Summary Tiles.
Deleting A Dashboard:
Click Delete for the dashboard line item to remove.
If Delete is not available to be selected, click Manage link first and change Is Default to No. Save the changes.
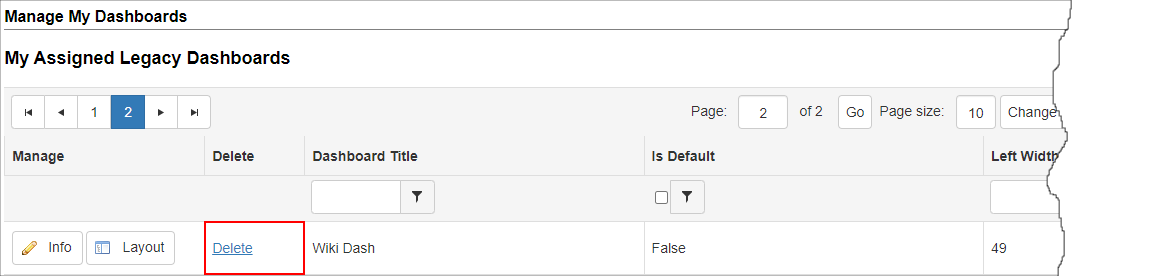
Once saved, Delete will be available.
When clicking Delete, a prompt will display to verify the to deletion of the dashboard. Click OK to proceed to delete it or click Cancel to return to the My Dashboard Manager screen.
Dashboard Docks
Dashboards: Docks
With each dashboard, a user is allowed to add up to 16 docks. A dock is a section of the dashboard that displays specifically requested information.
Adding a Dock
1. Navigate to the My Dashboards screen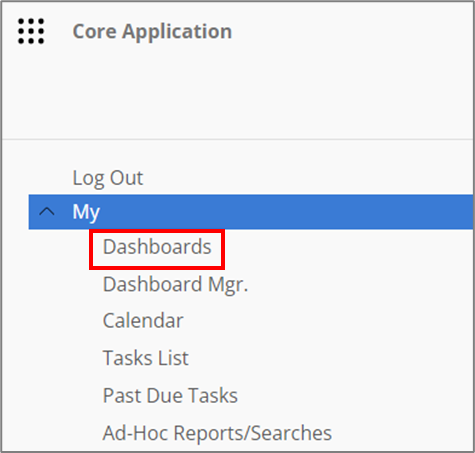
2. From the Select Your Dashboard drop down menu, select the dashboard for which a dock is to be added.
3. Click Manage Docks & Tiles.
4. Once on the Add Dashboard Dock Screen, choose the Docks, Button Tiles, or Summary Tiles tab
Docks
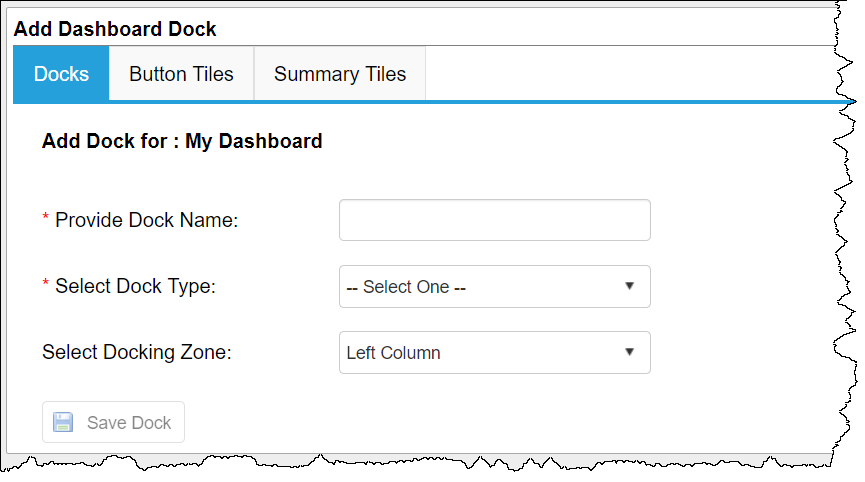
1. When selecting a dock type to add, there are several options.
2. Depending on the type of dock you select you will be provided with additional options:
a. My Calendar - This will add your calendar to the dashboard appears on the screen
b. Ad-Hoc Reports/Searches - A new drop down box with a list of all Ad-Hoc Reports/Searches available appears (see Ad-Hoc Wizard Overview Wiki page for more information on Ad-Hoc Reports/Searches).
c. Legacy Custom Searches - A new drop down box with a list of all Legacy Custom Search reports available appears.
Note: Any docking station that displays an Ad-Hoc Report/Search or Legacy Custom Search Report has the option of limiting the number of result rows displayed.
d. Web Address- you may add any web address to be able to access from your dashboard (i.e. http://www.CobbleStone®systems.com). Be sure to include http:// or https:// as applicable to the site.
Note: Not all websites permit display within such a dock.
3. Select the docking zone for which the new dock should be added.
4. Click Save Dock.
5. The after selecting Save Dock, the dashboard to which the dock was added is modified. Good Save! displays upon a successful save.
6. Click My Dashboards from the side menu to display the new dashboard with the dock in place.
Note: CobbleStone® Software Best Practices recommends adding no more than six (6) docks per dashboard.
Button Tiles
Button tiles are user created shortcuts to various parts of the system or to an external site.
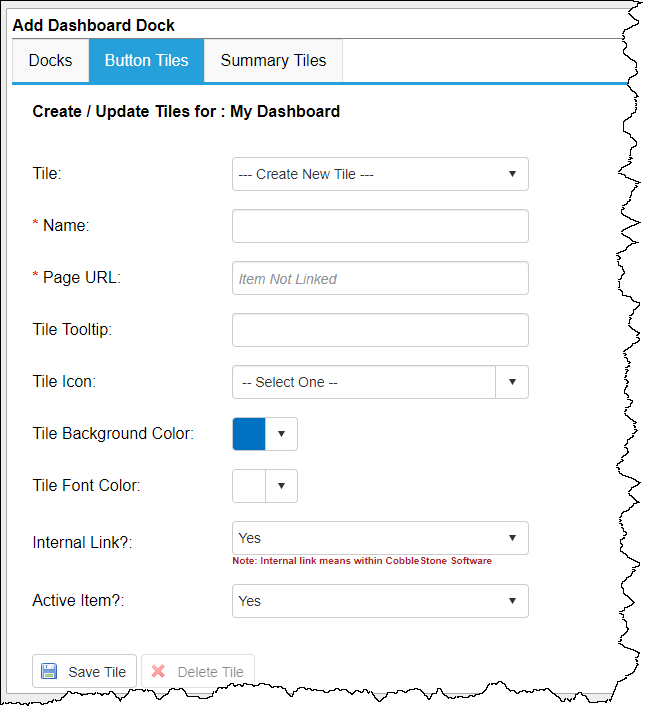
1. Select the Button Tiles tab
2. Leave as --- Create New Tile --- to create a new tile (To edit an existing tile, select it from the drop down list)
3. Give the Button Tile a Name
4. Provide the destination Page URL
5. (Optional) Add a Tile Tooltip to show when the user hovers the mouse button over the Button Tile
6. (Optional) Choose a Tile Icon to show on the Button Tile
7. (Optional) Customize the Tile Background Color and Tile Font Color
8. Choose whether the tile is an Internal Link (internal means within Contract Insight). If internal, the URL will open in the same tab, otherwise, it will open in a new tab.
9. Choose whether the tile is an Active Item
10. (When modifying existing tile only) Specify the Order number of the Tile shown on the Dashboard
11. Click Save Tile
Summary Tiles
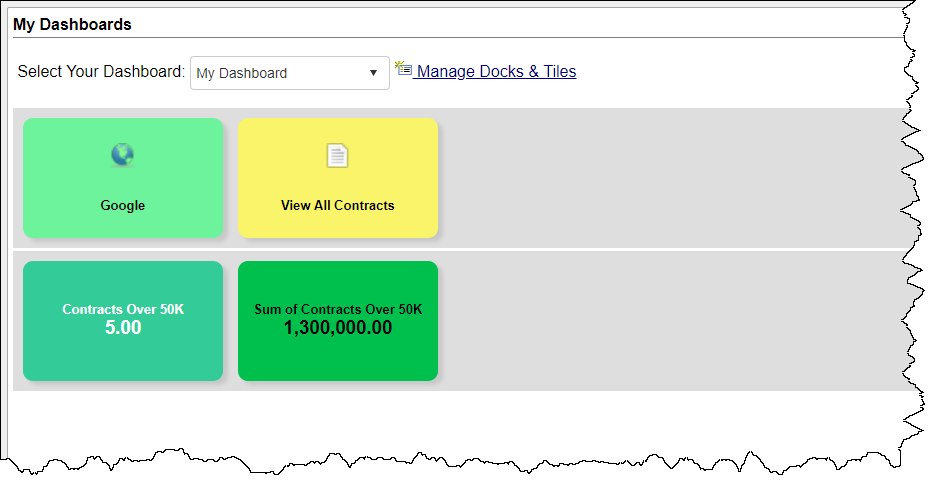
Summary Tiles are used to show summarized information from the various Ad-Hoc Reports and appear below any Button Tiles on the Dashboard.
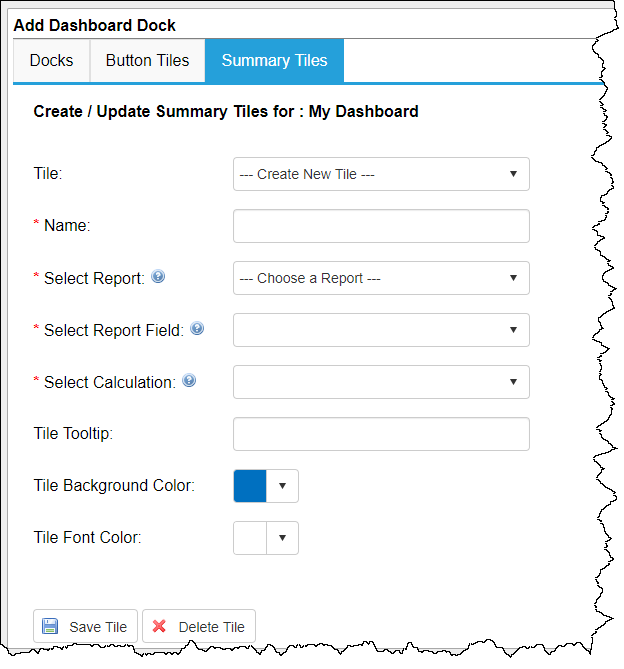
1. Select the Summary Tiles tab
2. Leave as --- Create New Tile --- to create a new tile (To edit an existing tile, select it from the drop down list)
3. Give the Summary Tile a Name
4. Select Report that contains the information to show
5. Select Report Field to be summarized
6. Choose the Calculation operation to be performed on the field.
7. (Optional) Add a Tile Tooltip to show when the user hovers the mouse button over the Summary Tile
8. (Optional) Customize the Tile Background Color and Tile Font Color
9. (When modifying existing tile only) Specify the Order Number of the Tile shown on the Dashboard
10. Click Save Tile
NOTE: A combination of Your Calendar, Summary Tiles, Button Tiles, and/or Ad-Hoc Reports may all be added to a dashboard.
Tiles show at the top of the Dashboard, with Button Tiles on top then Summary Tiles underneath. Any other Dashboard Docks that were created will show under the Tiles.