STIMULSOFT GRAPHICAL DASHBOARDS
The New Stimulsoft Dashboard presents a top-in-the-class kind of modern dashboard with graphical elements to provide valuable information to the user at a glance. This dashboard can be used to compare various fields, show summary of various fields, etc.
Using the Stimulsoft Dashboard is like using the Stimulsoft Report in CobbleStone. Just like the Stimulsoft Reports, Dashboards generated with this tool will not enforce Application User Permissioning without the appropriate filters defined within the Dashboard. Hence, only System Admins can create new Dashboards.
To Create a New Dashboard :
Step 1 : Go to your Dashboard
Step 2 : Click on Add New Dashboard.
Step 3 : Choose Graphical Dashboard.
Step 4 : Type in a Dashboard Name, choose the various sections from which the data is to be collected for the Dashboard, and type in a description for the Dashboard.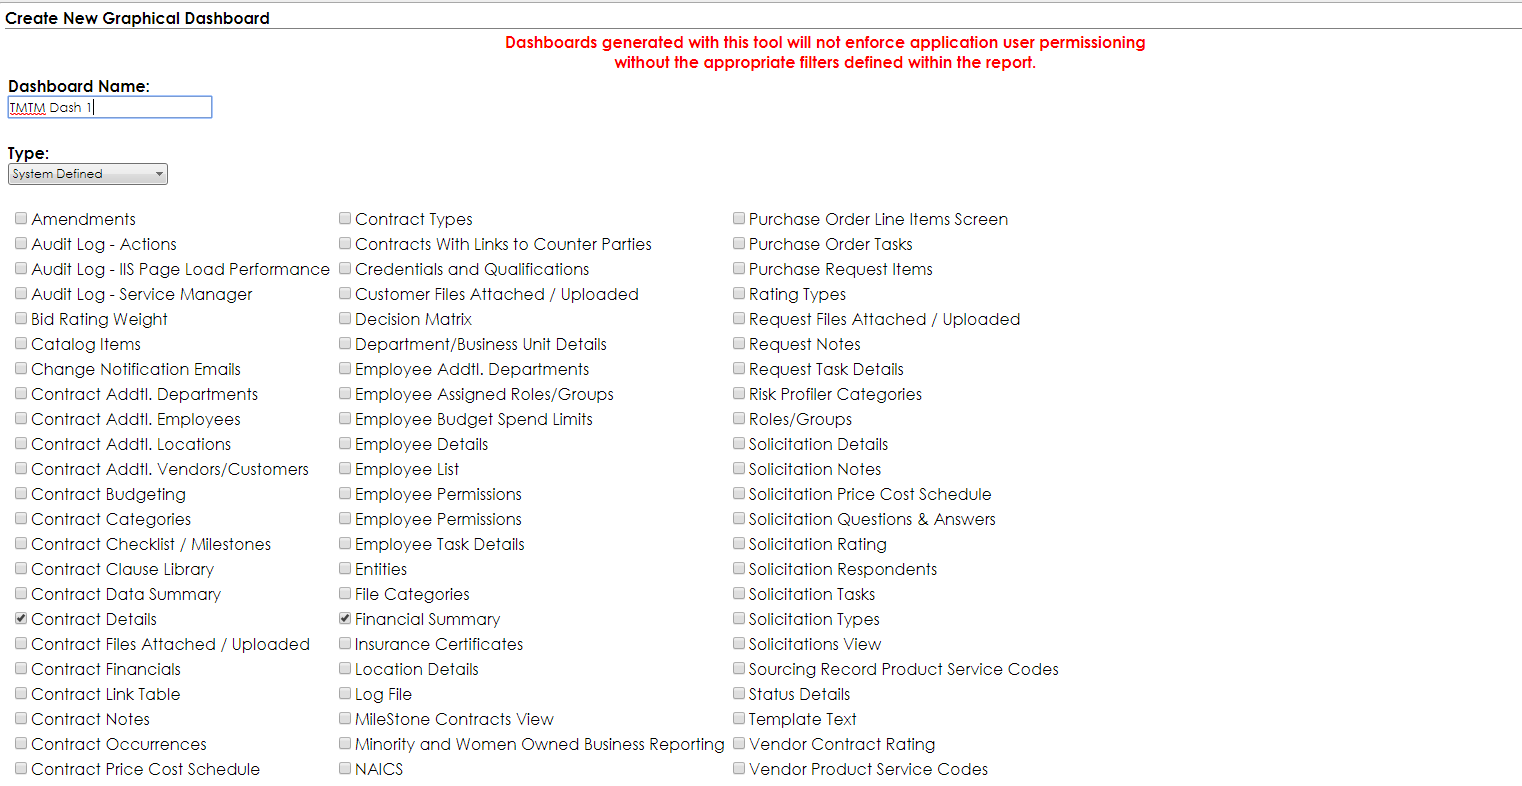
Step 5 : Click on Create Dashboard button.
Step 6: You’ll arrive on the Dashboard Designer page.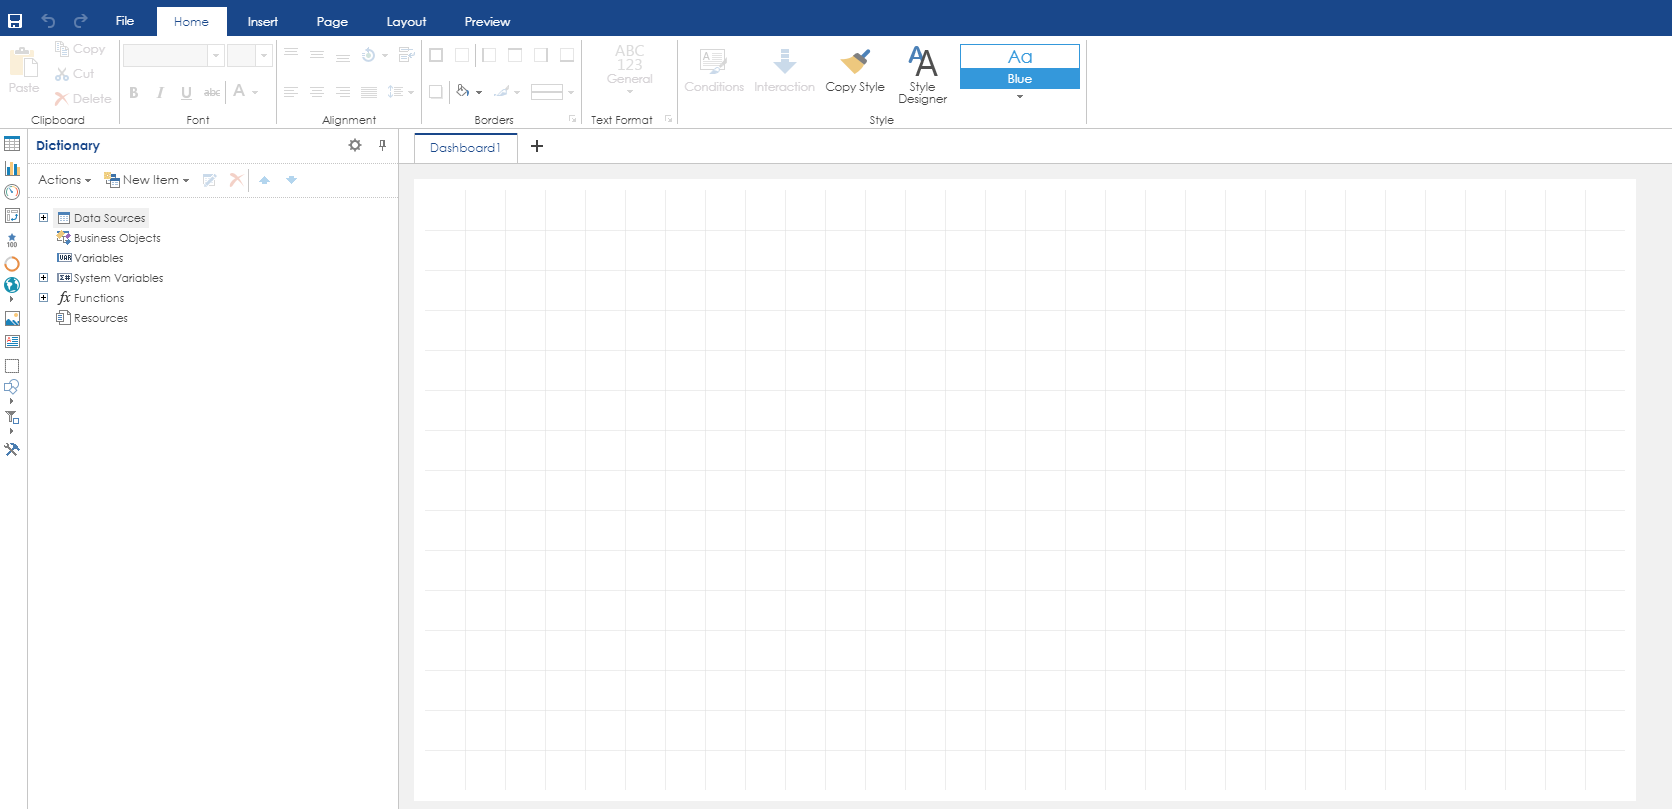
Step 7: Expand the Data Sources to reveal all your fields.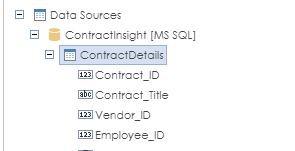
Step 8 : Go to the Insert tab and click on the type of Graphical chart you need.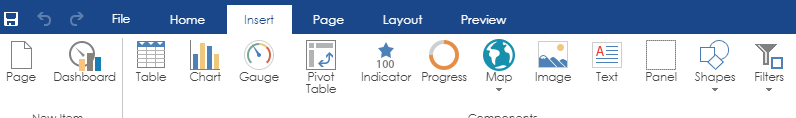
Step 9 : Once you click on one of the elements, go to the Design board and click where you want the graph to appear. The chart should appear where you clicked with a Drag & Drop data from dictionary box with it.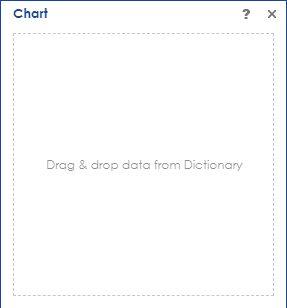
Step 10 : Drag one of the fields from the left side menu Data Sources to the box.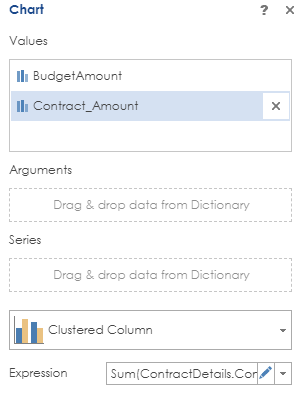
Step 11 : You can type in custom expression by clicking on the Edit icon on the Expression field (the last field in the box), where you can write your custom expression.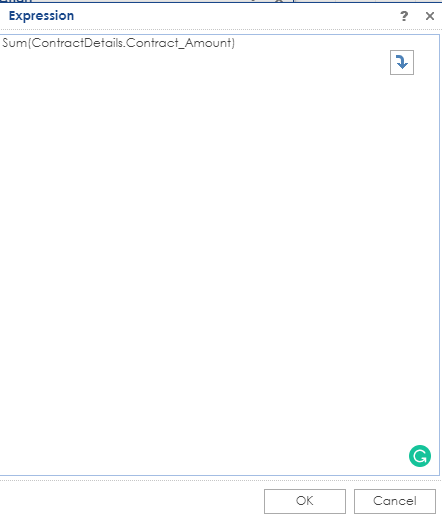
Step 12 : Click on the Close button in the expression box. Now you can resize the Graphical Element in the Designer view.
Step 13 : Continue the steps 8 to 12 for other graphical elements that you need.
Step 14 : Once you are finished with the Design, press the Save icon and then press File > Exit to exit the Stimulsoft Dashboard Designer.
Step 15: The next screen will show the various details about the dashboard. At this screen, assign the newly created dashboard to the users (including the creator of the dashboard). This is because the dashboard won’t take user permissions into consideration.
Step 16 : You have created your awesome Graphical Dashboard!